
Partner-dependence checks across outcome families
Source:vignettes/articles/partner-dependence-simulation.Rmd
partner-dependence-simulation.RmdWhat these plots compare
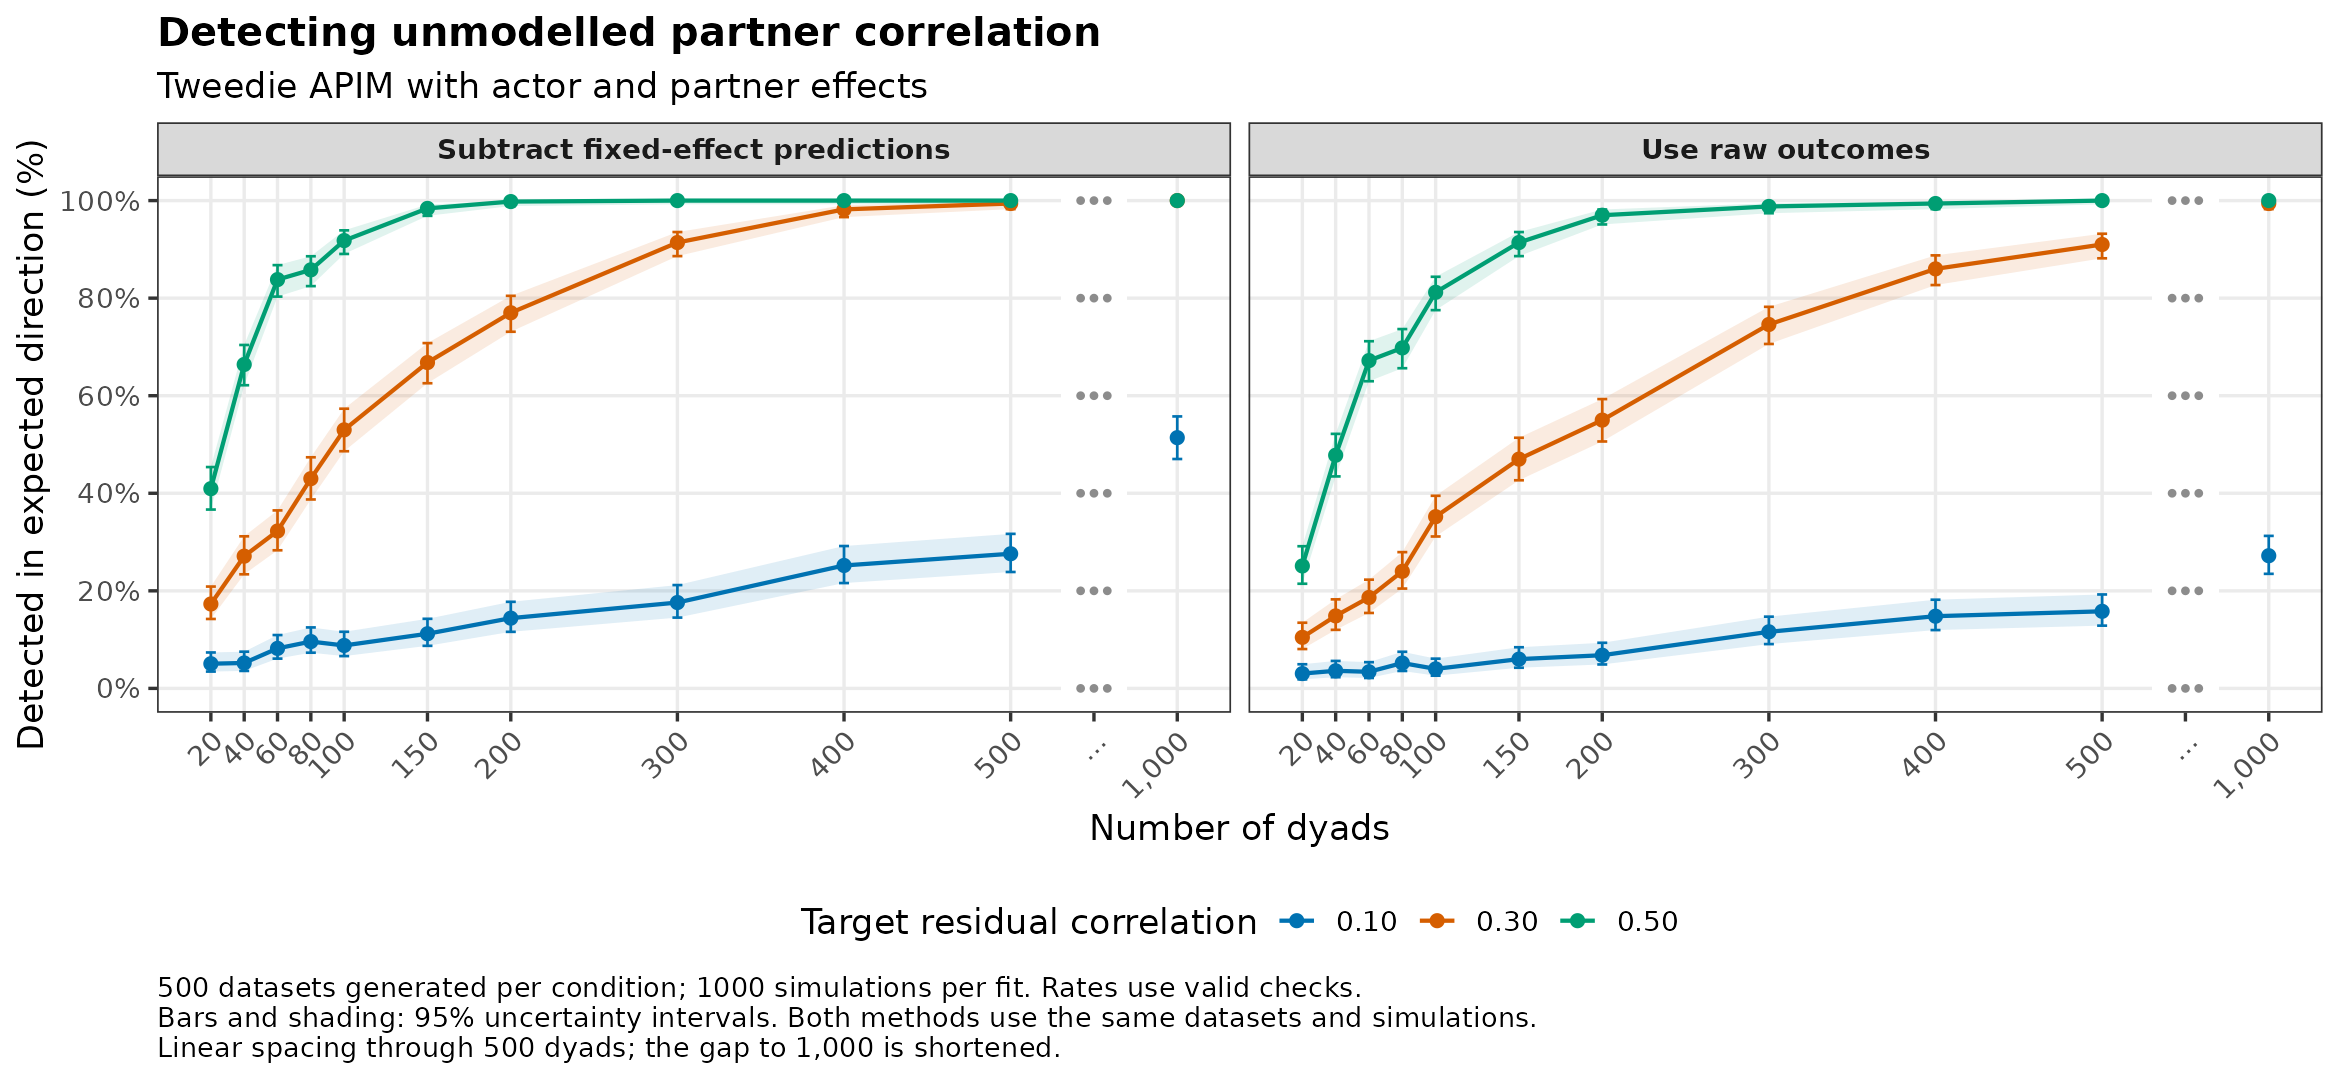
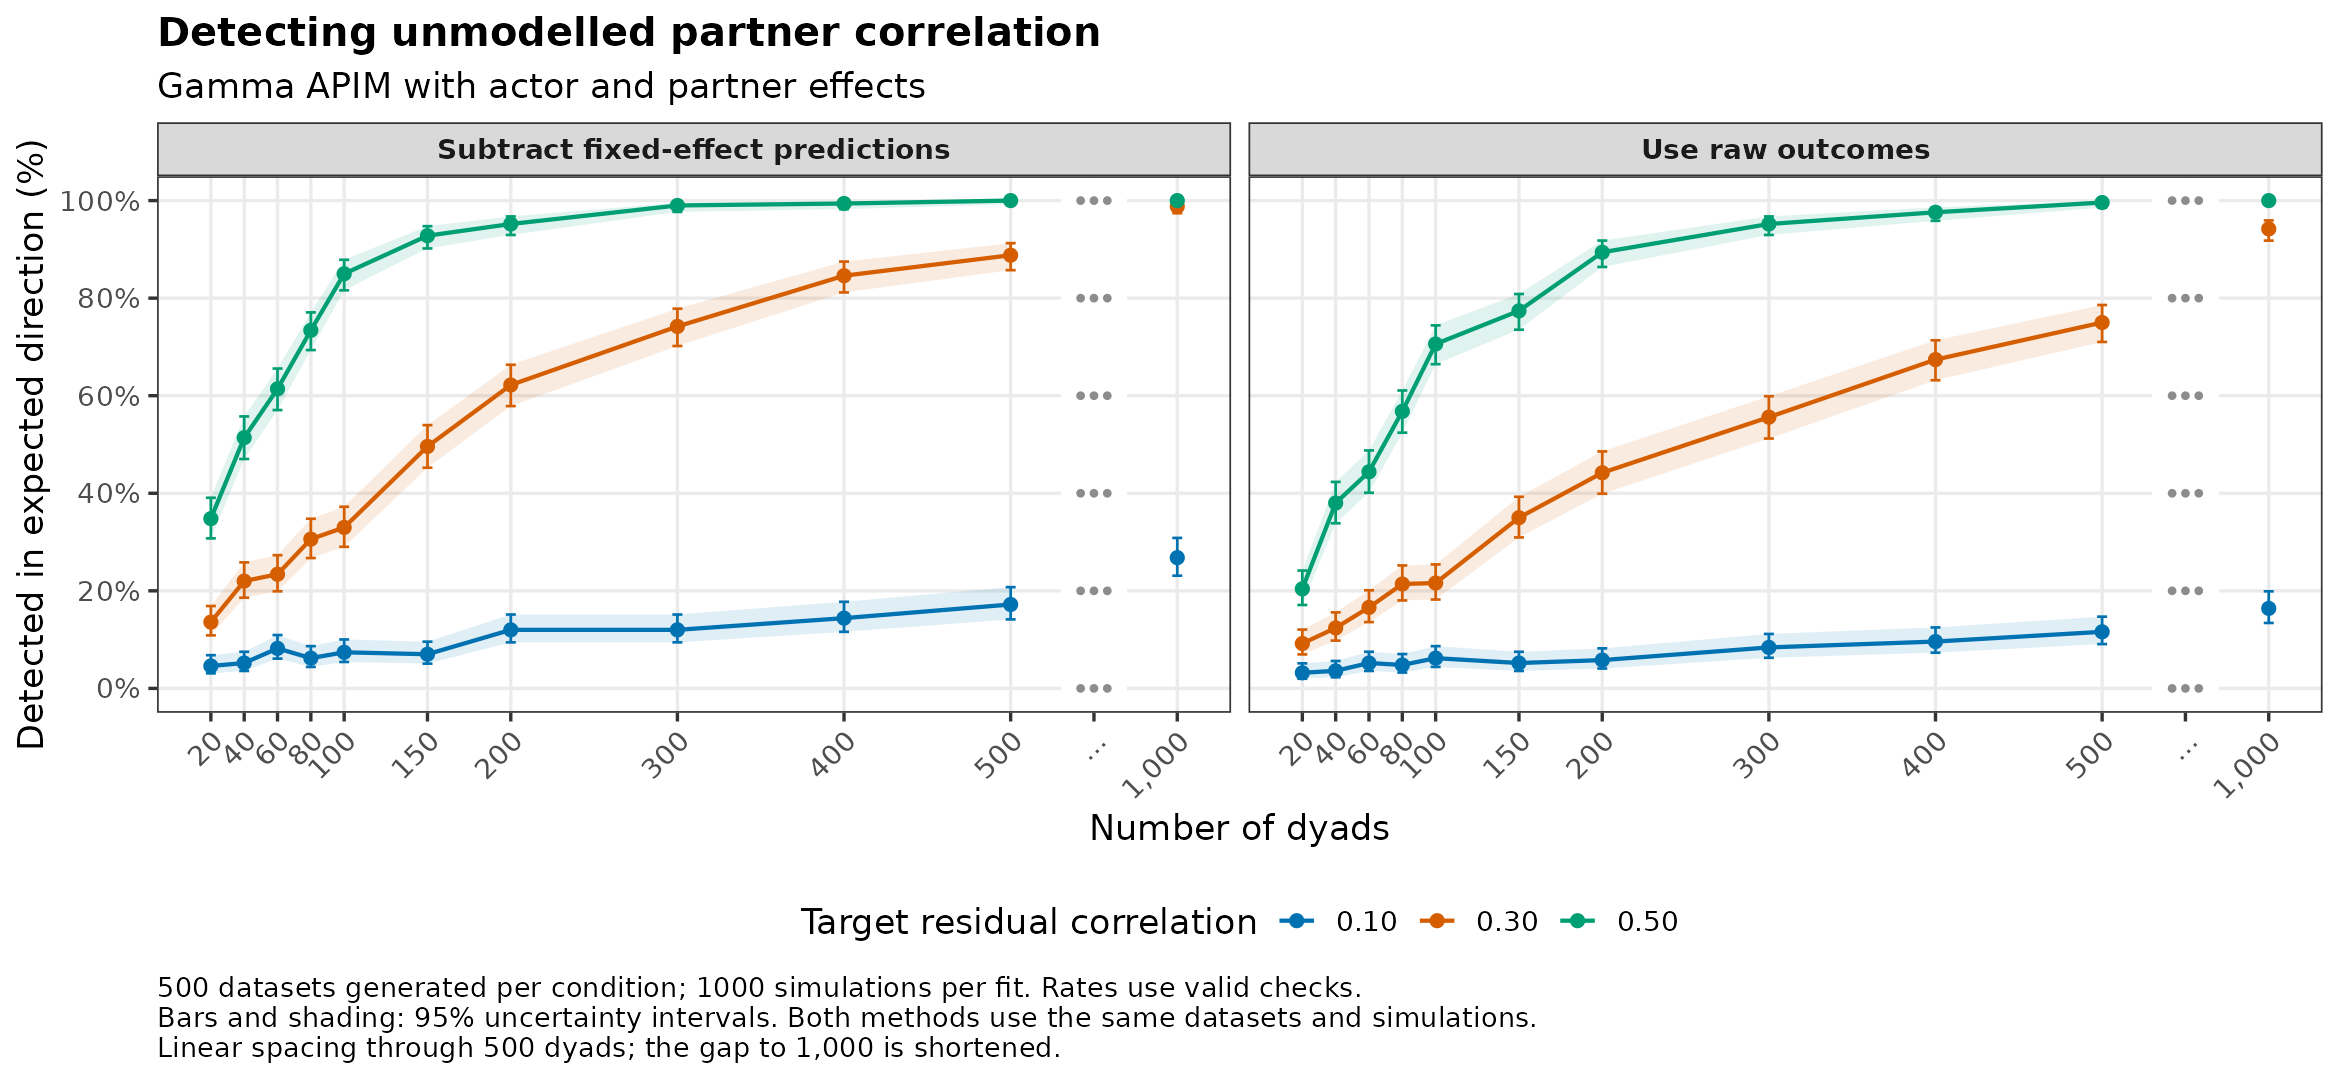
The models include actor and partner effects but leave out residual partner dependence. We compare checks of raw outcomes with checks that first subtract fixed-effect predictions. Both use the same datasets, fitted models, and reference simulations. Each check uses one summary: the correlation between the first and second partner in each dyad. The covariance-pooling study checks all summaries within each dyad composition.
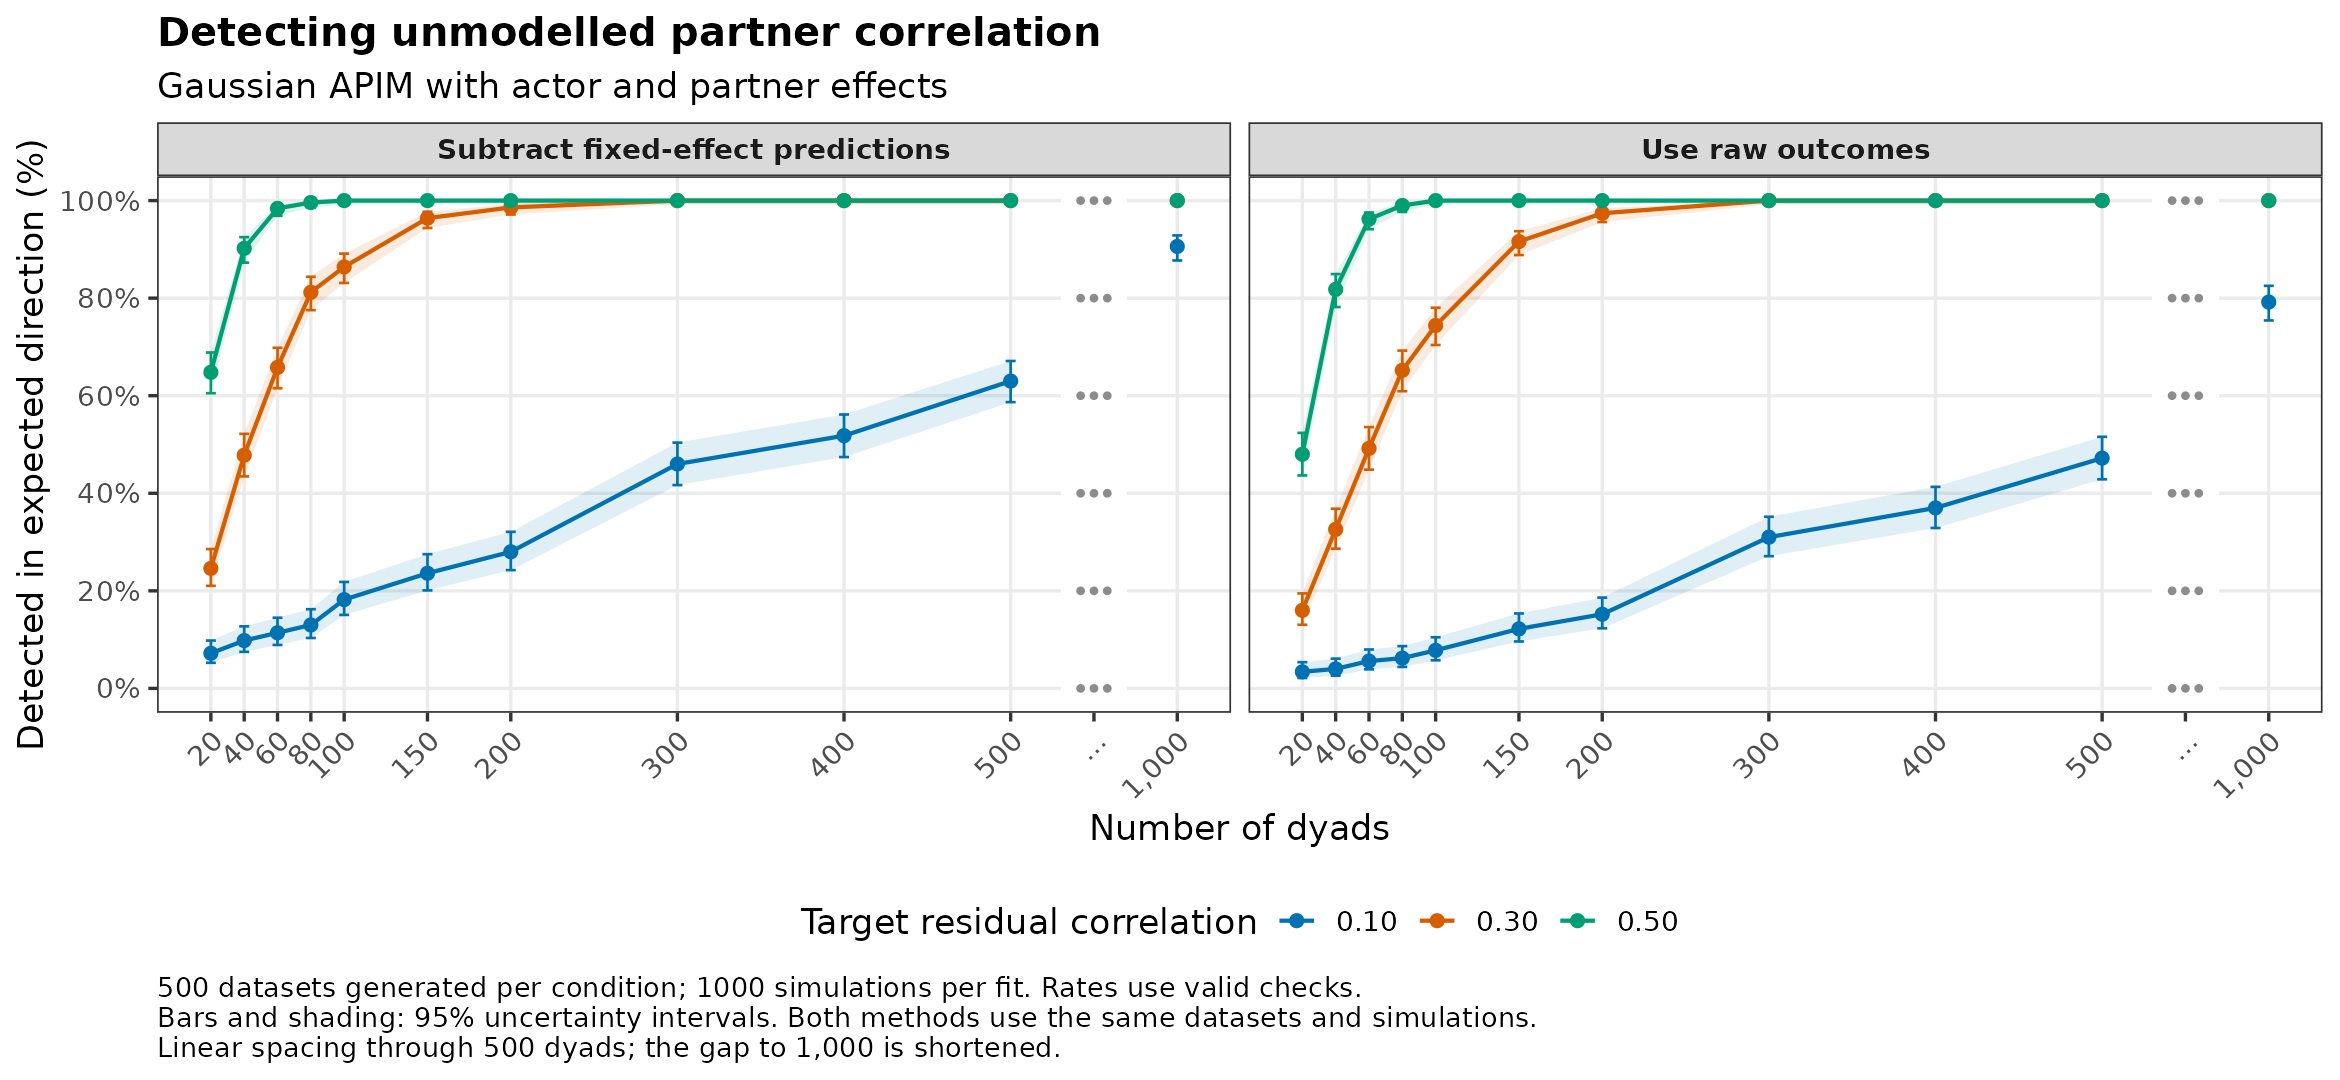
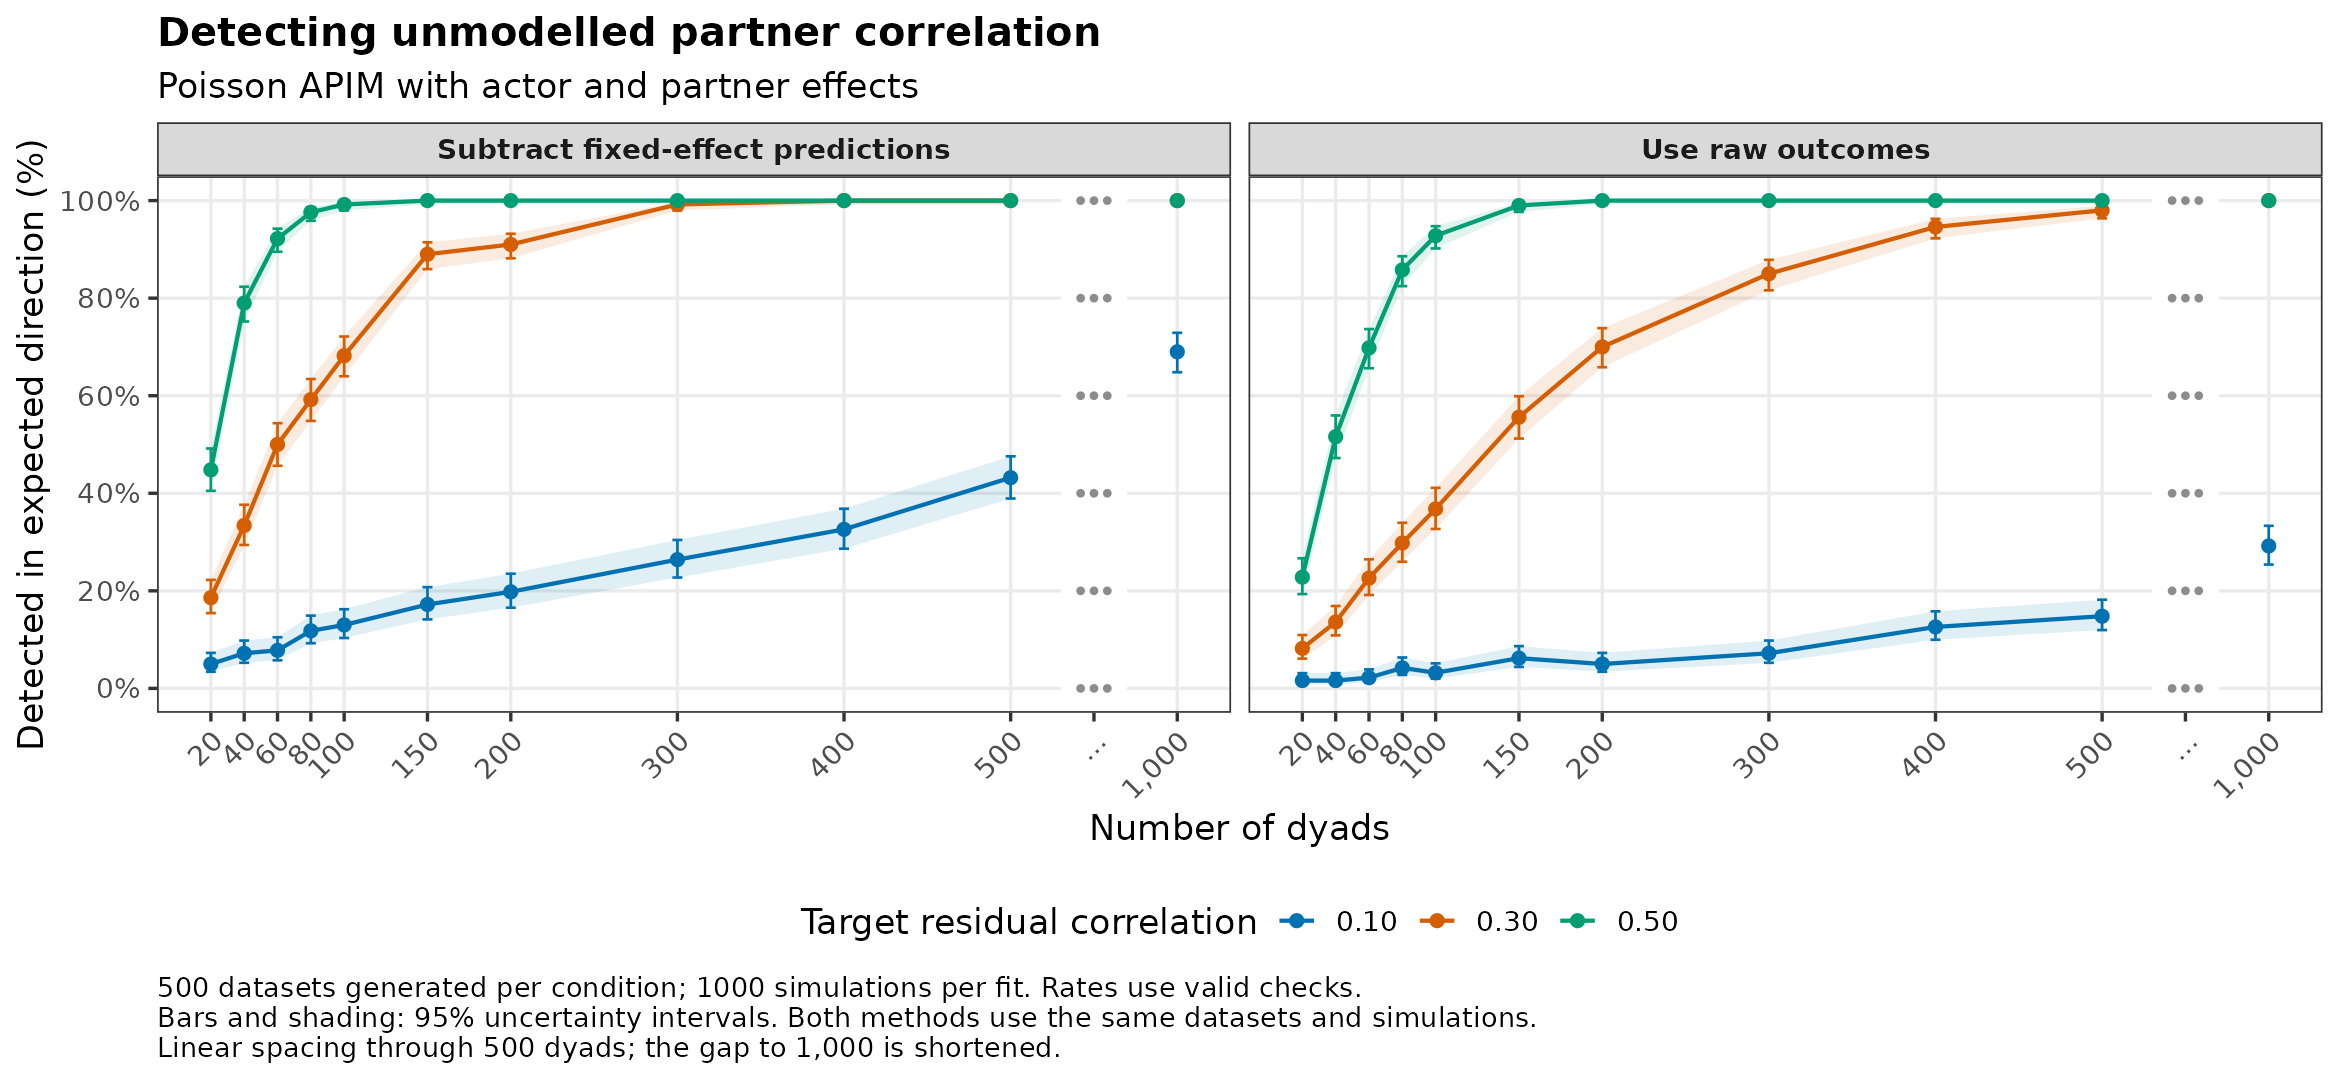
- Coloured lines: how often the check detects omitted positive correlation. A mismatch is detected when the observed correlation exceeds the upper limit of the model’s middle 95% simulated range. Flags below the lower limit are listed separately in each family’s details.
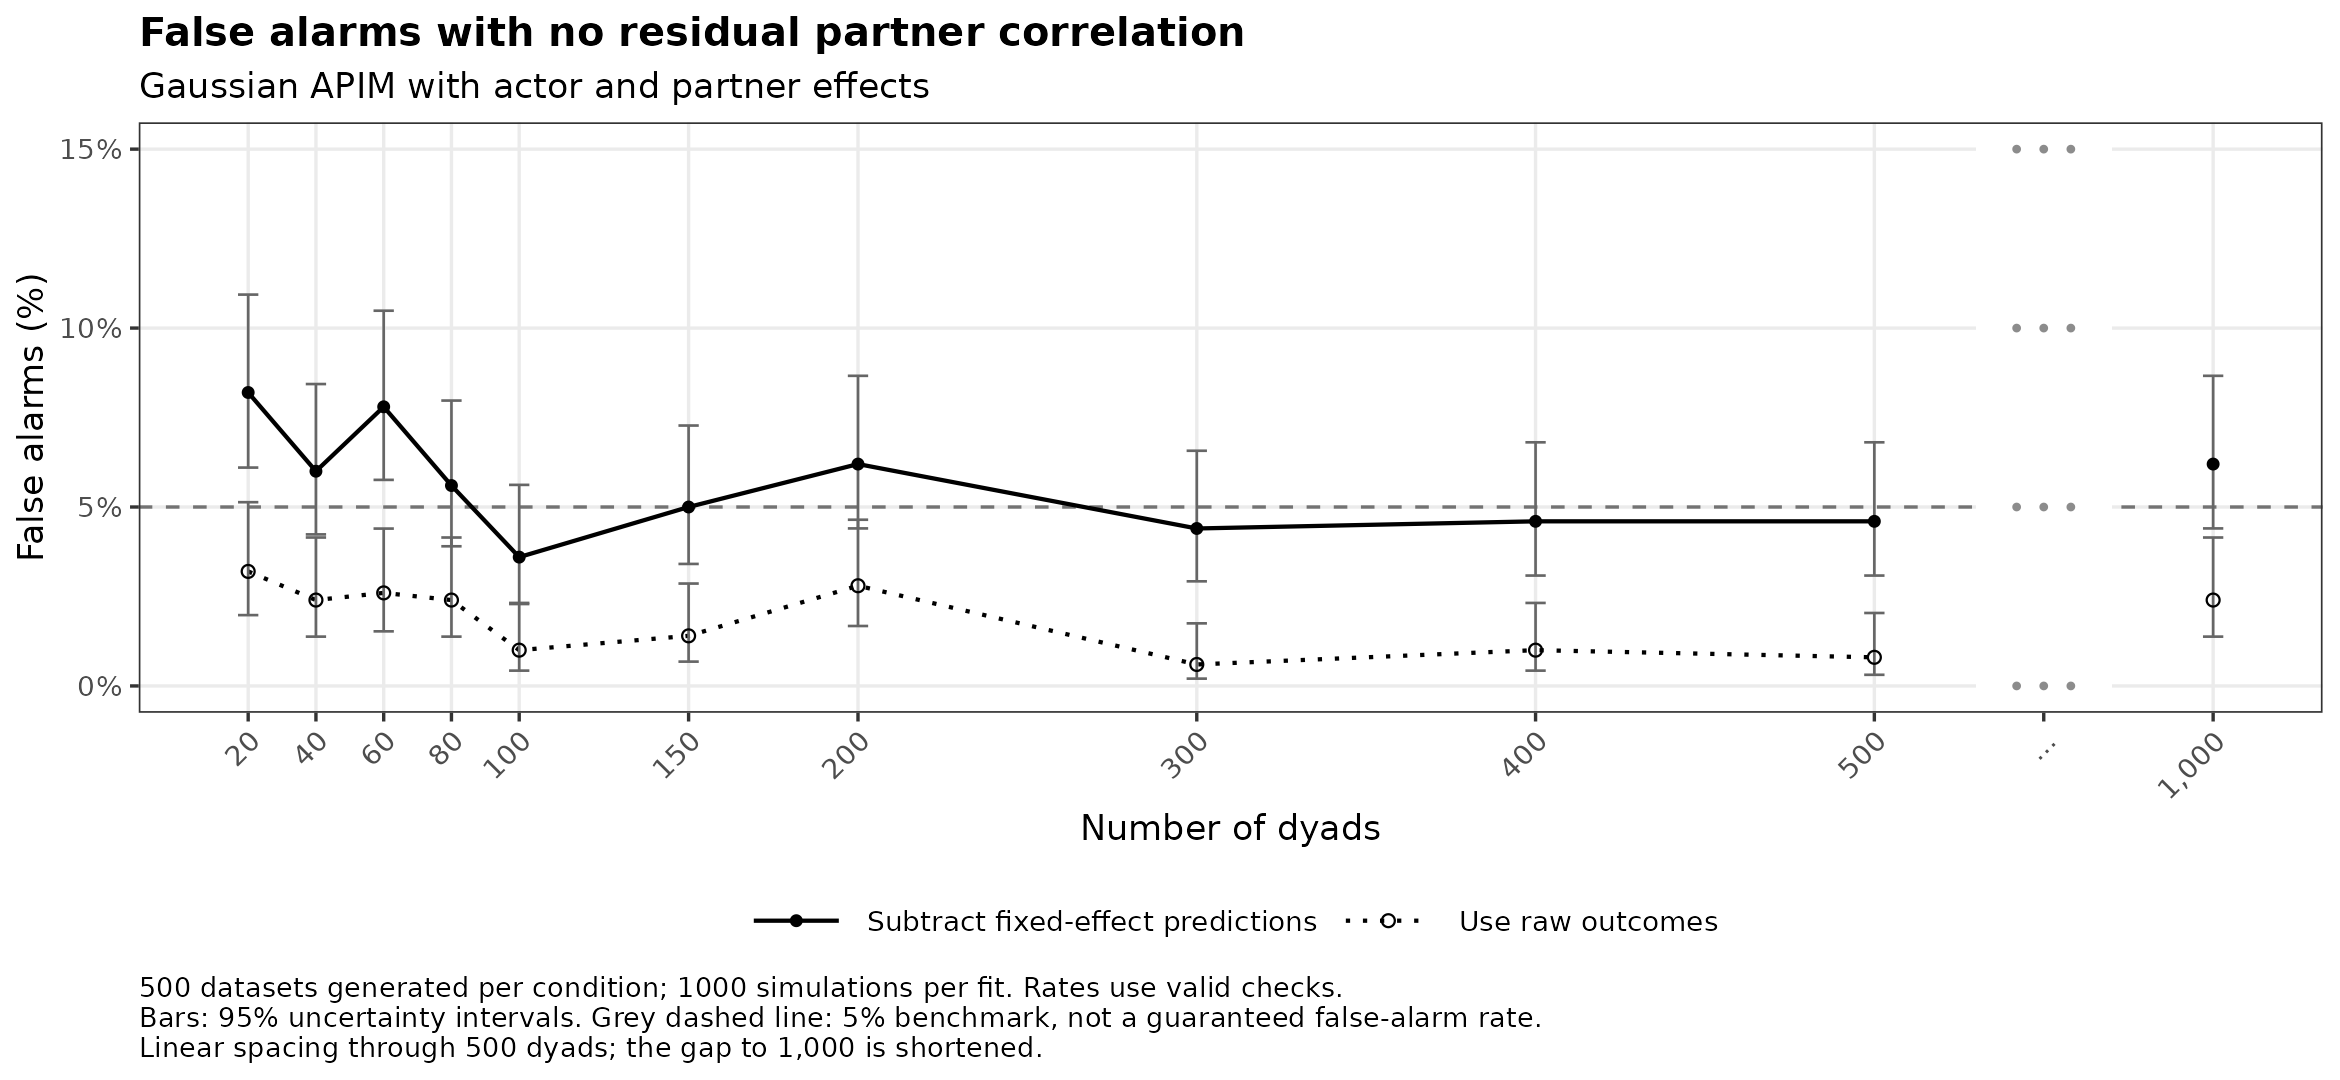
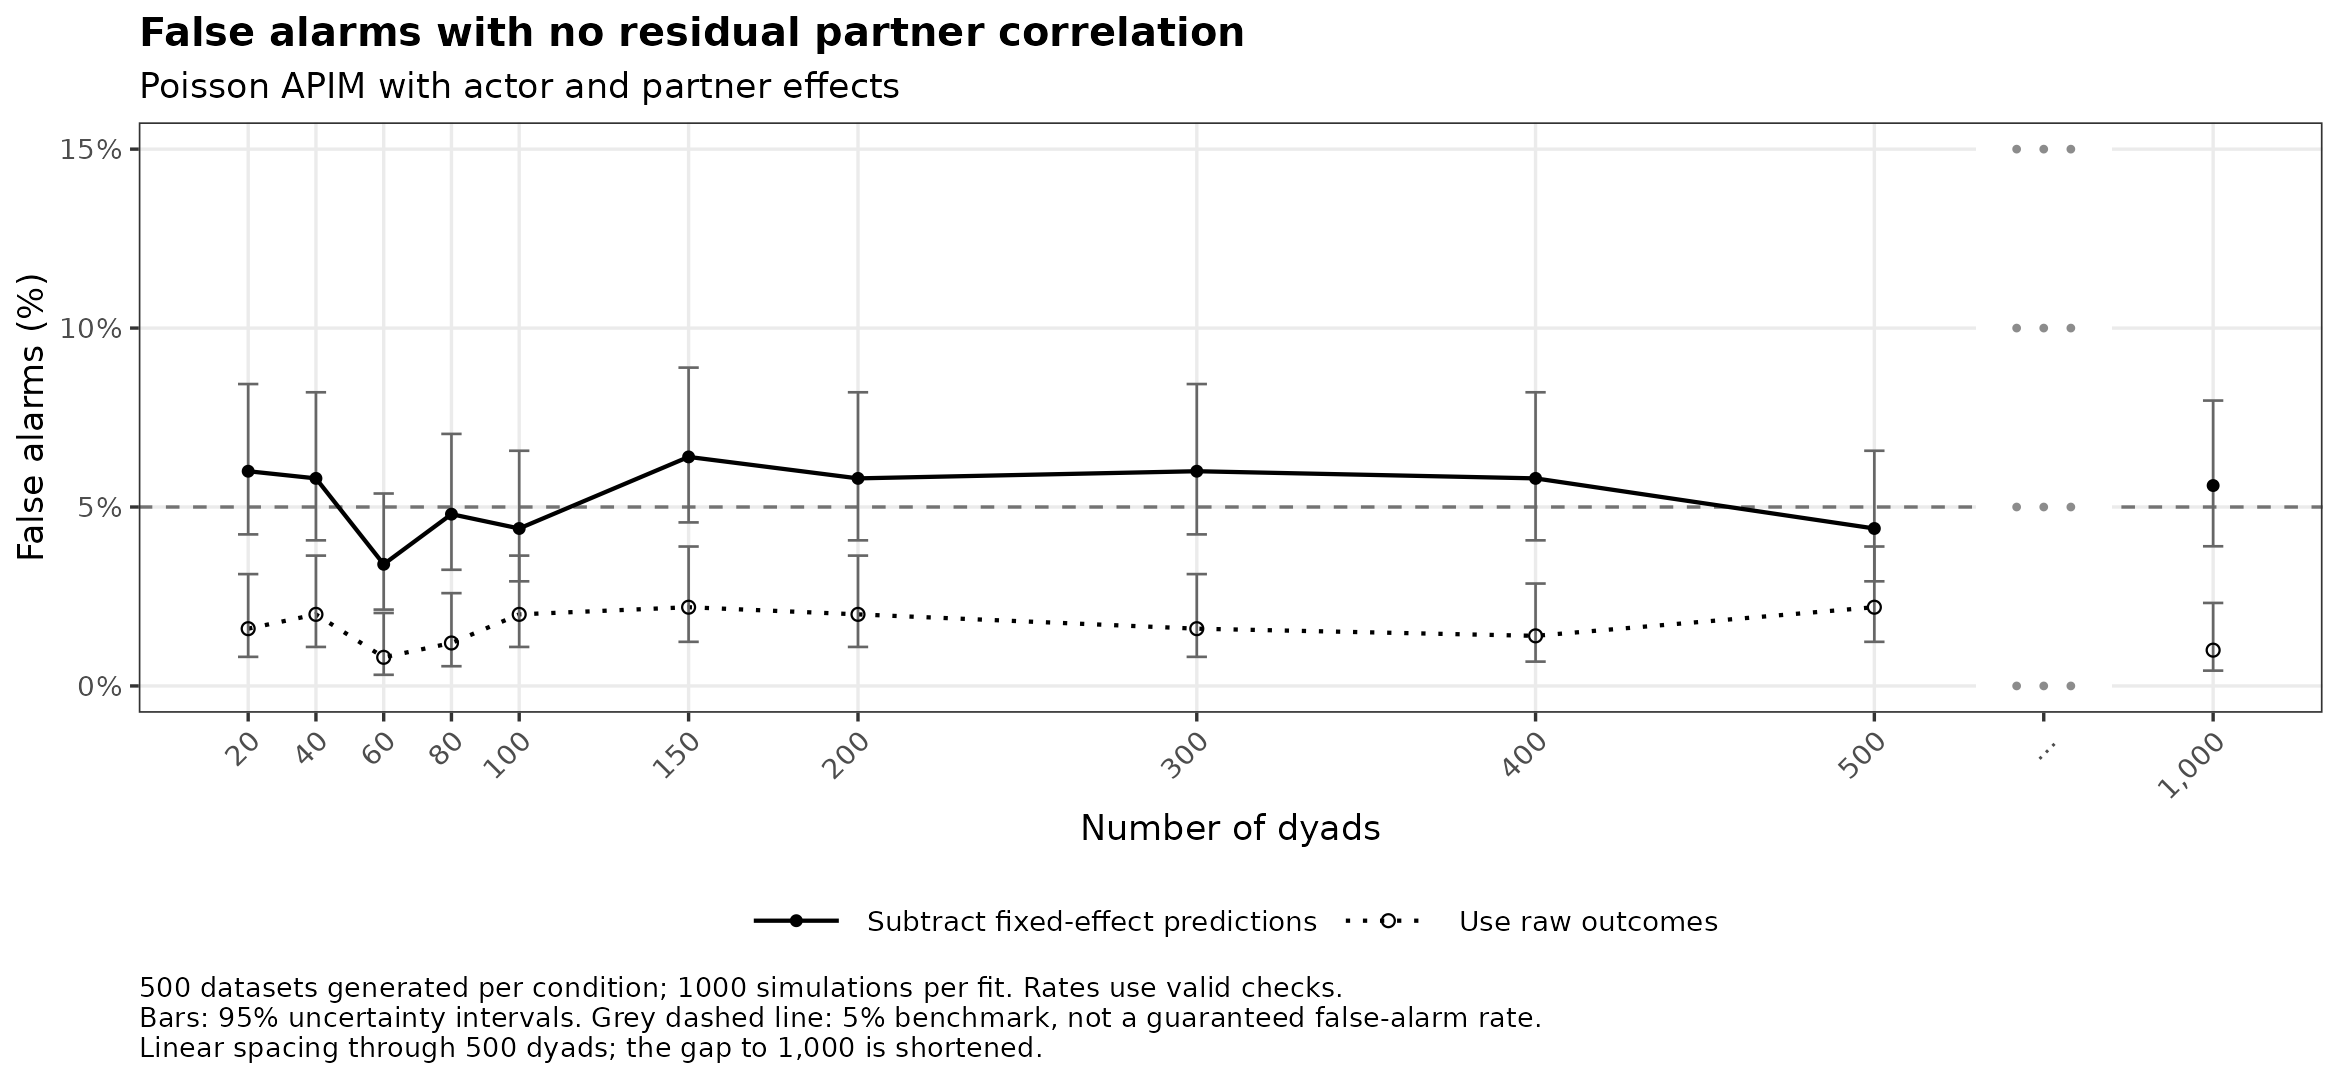
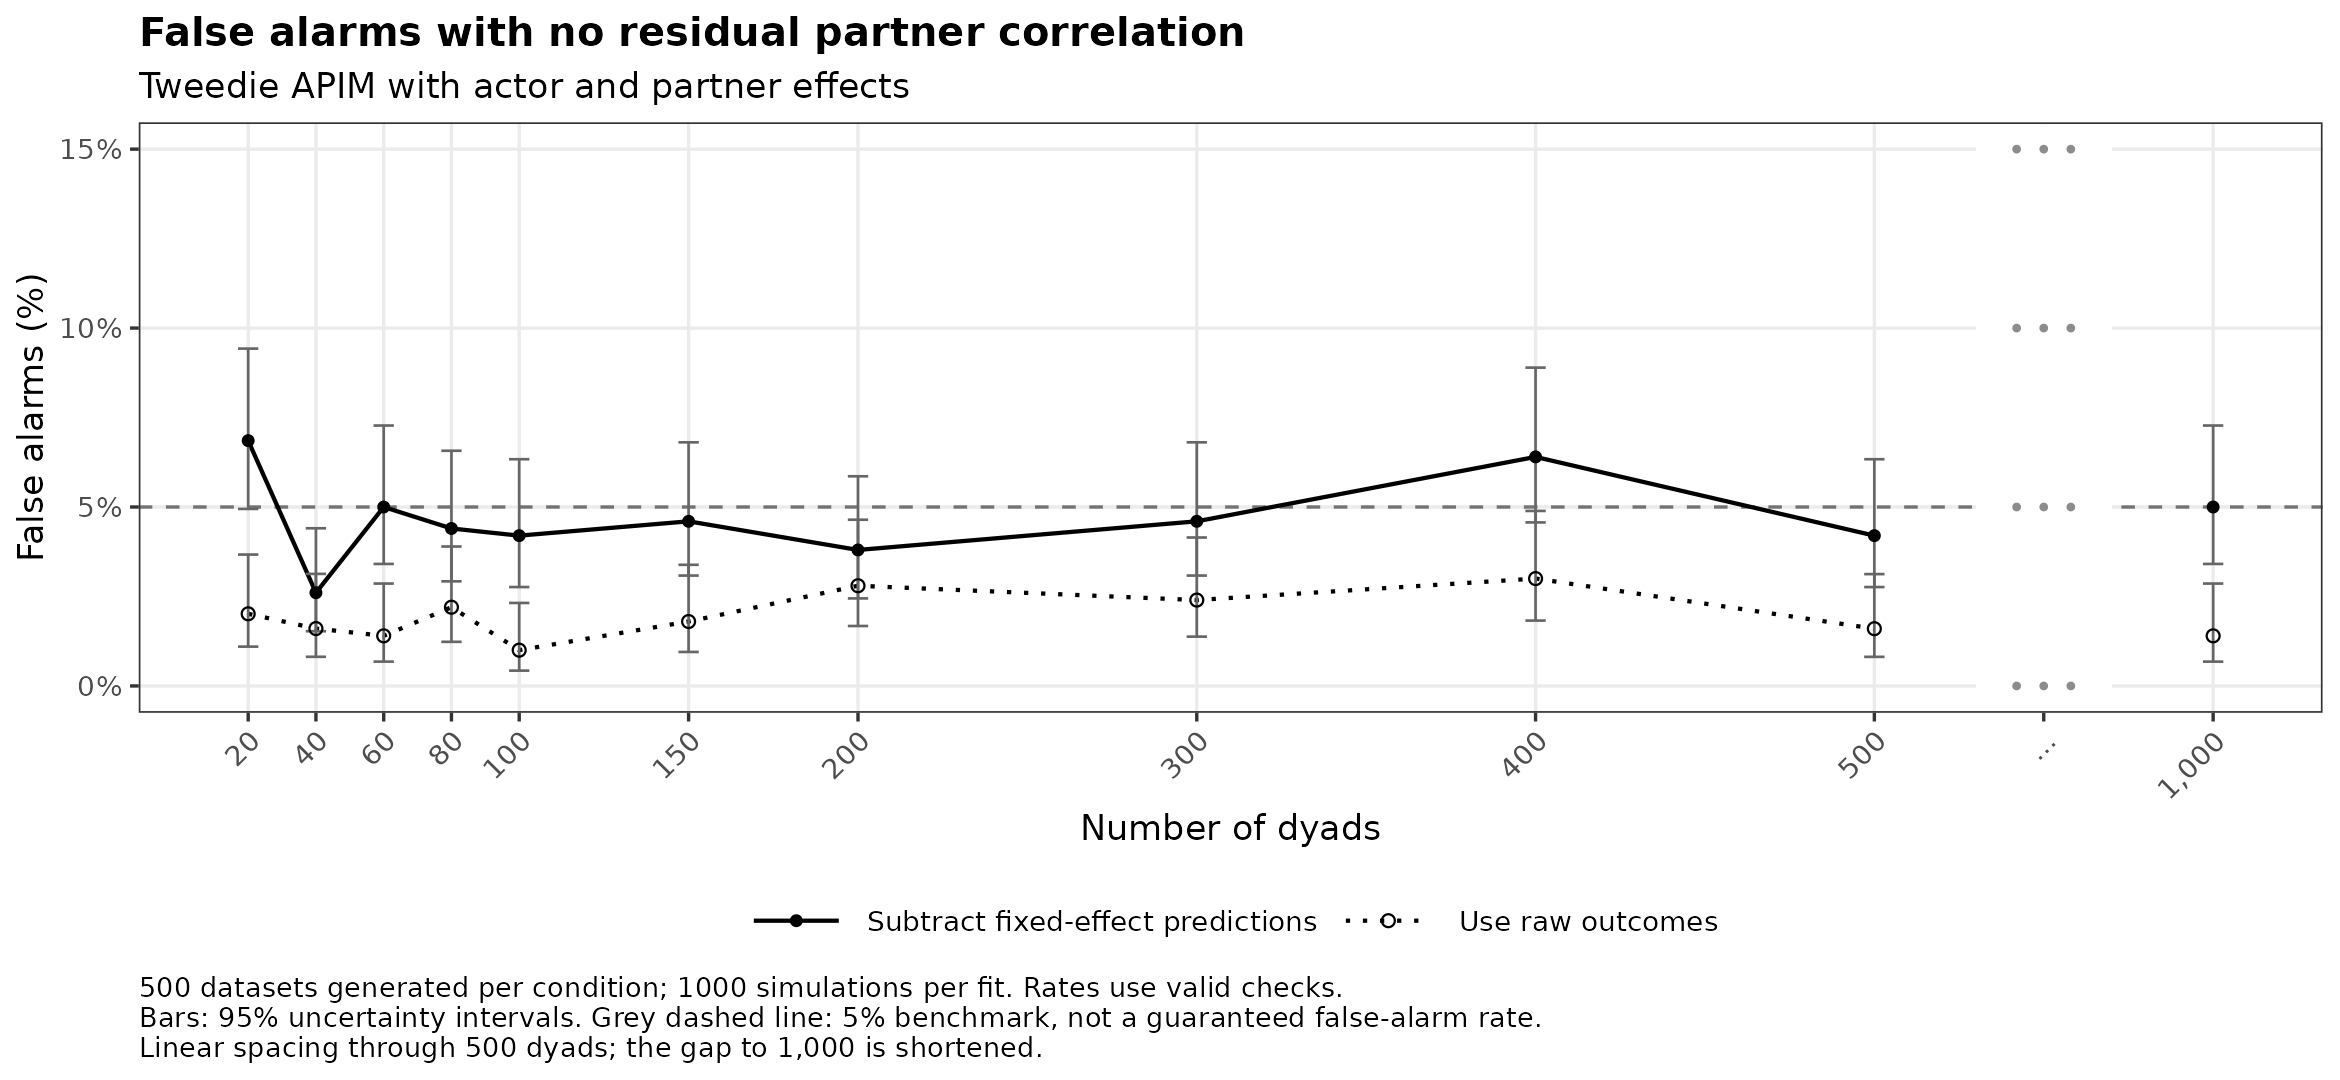
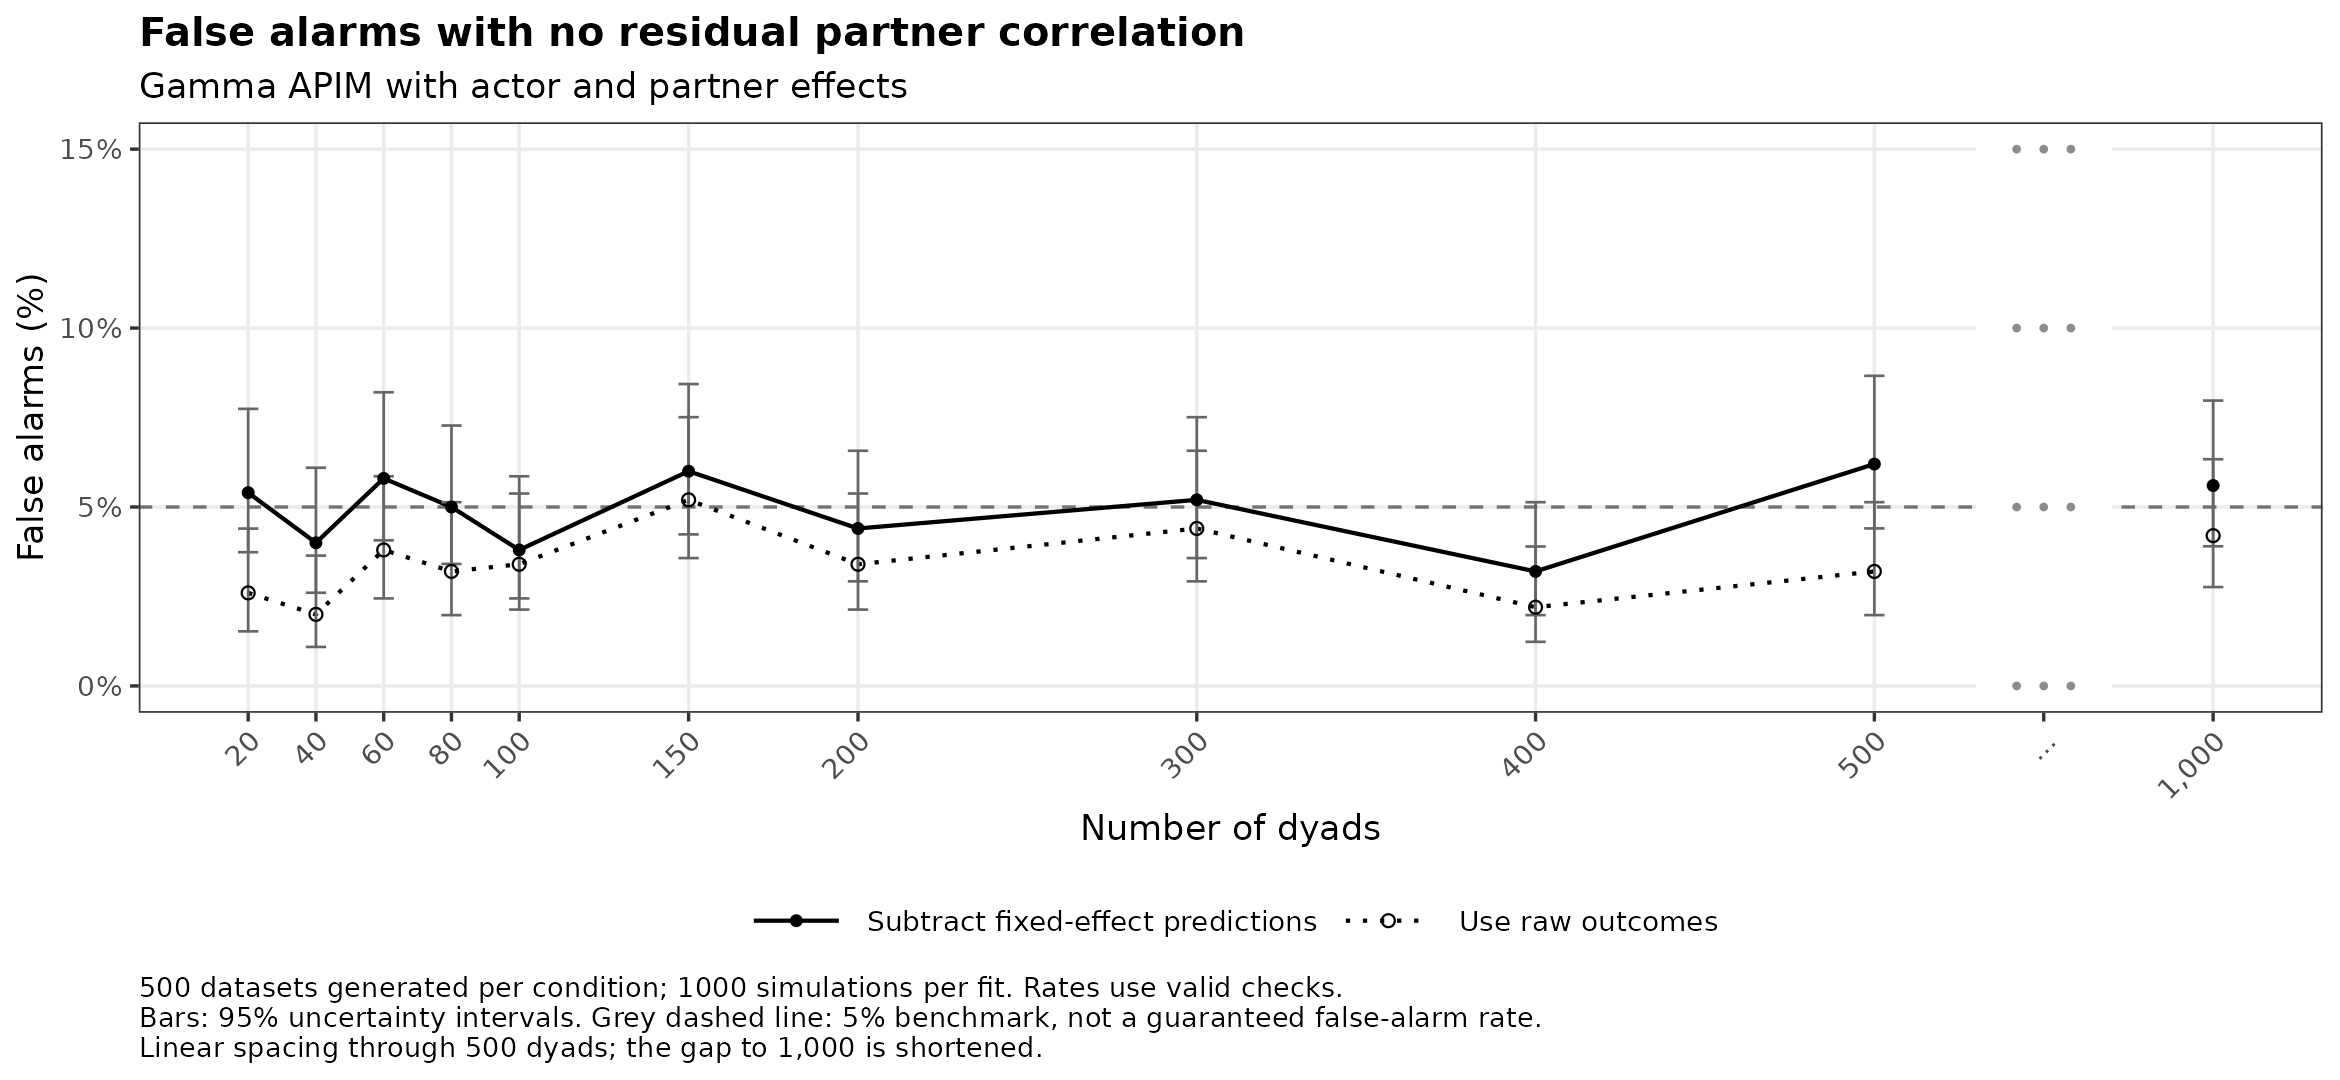
- Black lines: false alarms when residual correlation is zero. Values below or above the middle 95% simulated range count as false alarms. The grey dashed line marks 5% as a benchmark, not a guaranteed rate. A full check shows four to six summaries per composition, so at least one flag is more likely than these rates suggest.
The results apply to the settings studied and can differ with other model settings. Rates include only usable fits. Many fits were excluded for skew-normal models and small Student t samples, mainly because of numerical problems during fitting.
Checks that subtract model predictions generally detected more omitted dependence than raw checks. Their false-alarm rates ranged from 4.7% to 5.9% across settings when pooled over sample sizes. Small residual correlations (0.10) were difficult to detect even with several hundred dyads. At 1,000 dyads, detection ranged from 27% to 91% across the studied settings.
Ordinal checks use category scores 1, 2, and so on. Zero-inflated and hurdle checks use the combined outcome, including zeros.
Study details
Predictors are standard normal with a partner correlation of 0.3. Actor and partner effects are 0.5 and 0.3 on the model’s link scale. We transform correlated normal draws to each outcome distribution using a Gaussian copula. We adjust their dependence to give residual correlations of 0, 0.10, 0.30, and 0.50 after subtracting the true means given the predictors.
Reference simulations keep fitted parameters and predictors fixed, without refitting the models. More simulations give more precise estimates of the 2.5th and 97.5th percentile limits. More study datasets give more precise estimates of the plotted rates. The bars and bands are 95% Wilson intervals for this Monte Carlo uncertainty.
We exclude failed fits and checks without retry, as well as ordinal datasets missing a category. Correlations must be defined to count as a valid check. Undefined simulated correlations are omitted from reference ranges. Each family’s details give exclusion counts and reasons.
Some Tweedie datasets used an equivalent, faster glmmTMB sampler; see the study notes.
The report uses saved results. See the study code, plot code, and study notes.
Gaussian
Model settings and checks
Fitted model:
outcome ~ actor_predictor + partner_predictor.
Mean: Actor effect 0.5, partner effect 0.3, identity link, intercept 0.
Dispersion: SD = 1
Population correlations
Exact Gaussian correlation.
| Target residual correlation | Verified correlation | Monte Carlo SE |
|---|---|---|
| 0.0 | 0.0 | 0 |
| 0.1 | 0.1 | 0 |
| 0.3 | 0.3 | 0 |
| 0.5 | 0.5 | 0 |
Opposite-direction flags with positive residual correlation
| Method | Datasets checked | Opposite-direction flags |
|---|---|---|
| model-centred | 16500 | 11 |
| raw | 16500 | 1 |
22000 of 22000 datasets produced reference simulations.
Counts for every plotted point are saved in the summary table.
Poisson
Model settings and checks
Fitted model:
outcome ~ actor_predictor + partner_predictor.
Mean: Actor effect 0.5, partner effect 0.3, log link, intercept 1.1.
Dispersion: Poisson mean
Population correlations
Gaussian copula calibrated with 200000 pairs and independently verified with 500000 pairs.
| Target residual correlation | Verified correlation | Monte Carlo SE |
|---|---|---|
| 0.0 | 0.001 | 0.002 |
| 0.1 | 0.098 | 0.002 |
| 0.3 | 0.298 | 0.002 |
| 0.5 | 0.497 | 0.001 |
Opposite-direction flags with positive residual correlation
| Method | Datasets checked | Opposite-direction flags |
|---|---|---|
| model-centred | 16500 | 21 |
| raw | 16500 | 2 |
22000 of 22000 datasets produced reference simulations.
Counts for every plotted point are saved in the summary table.
Negative binomial (NB1)
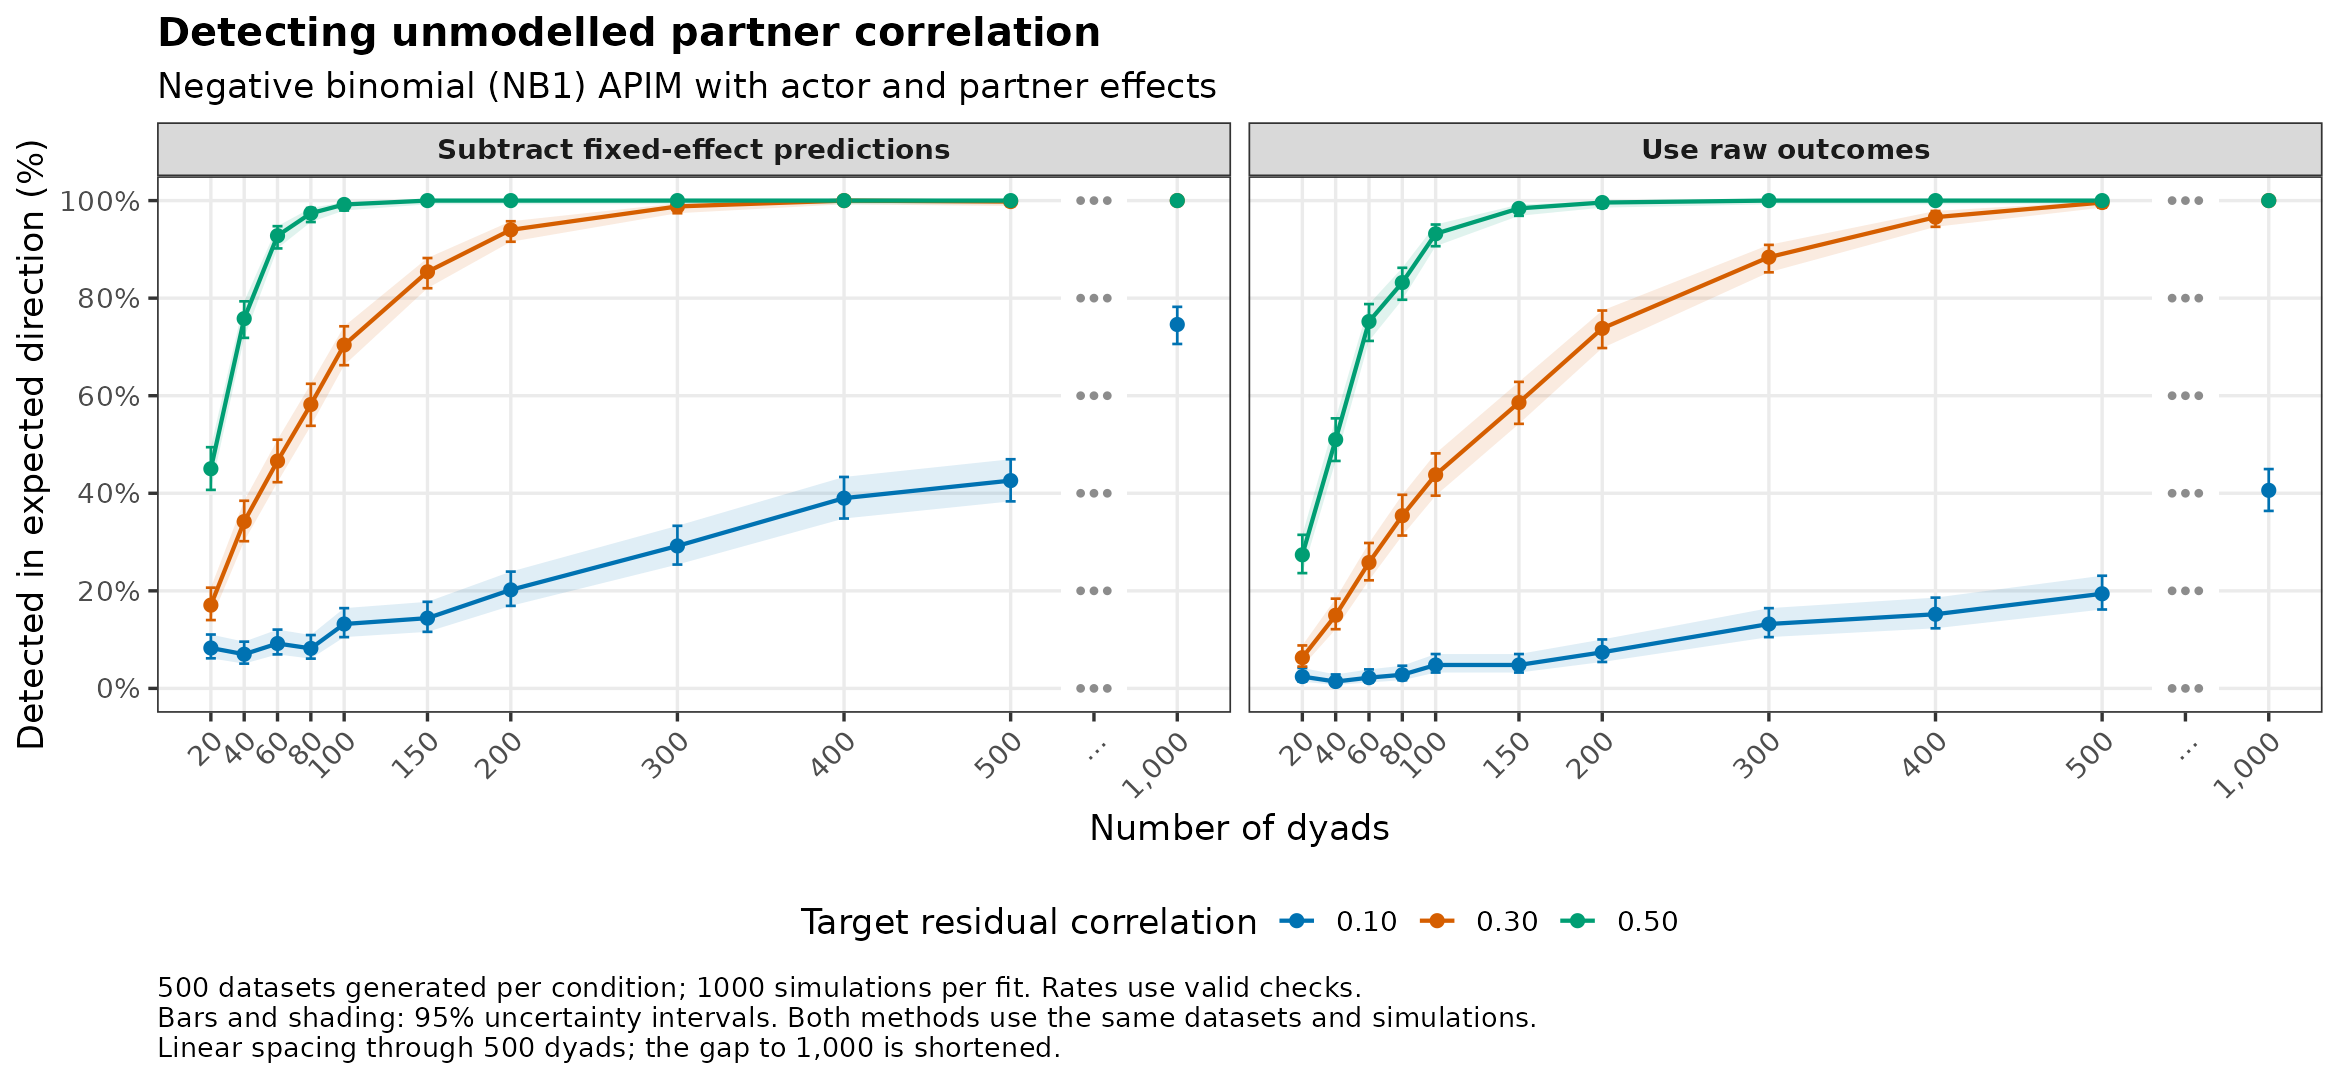
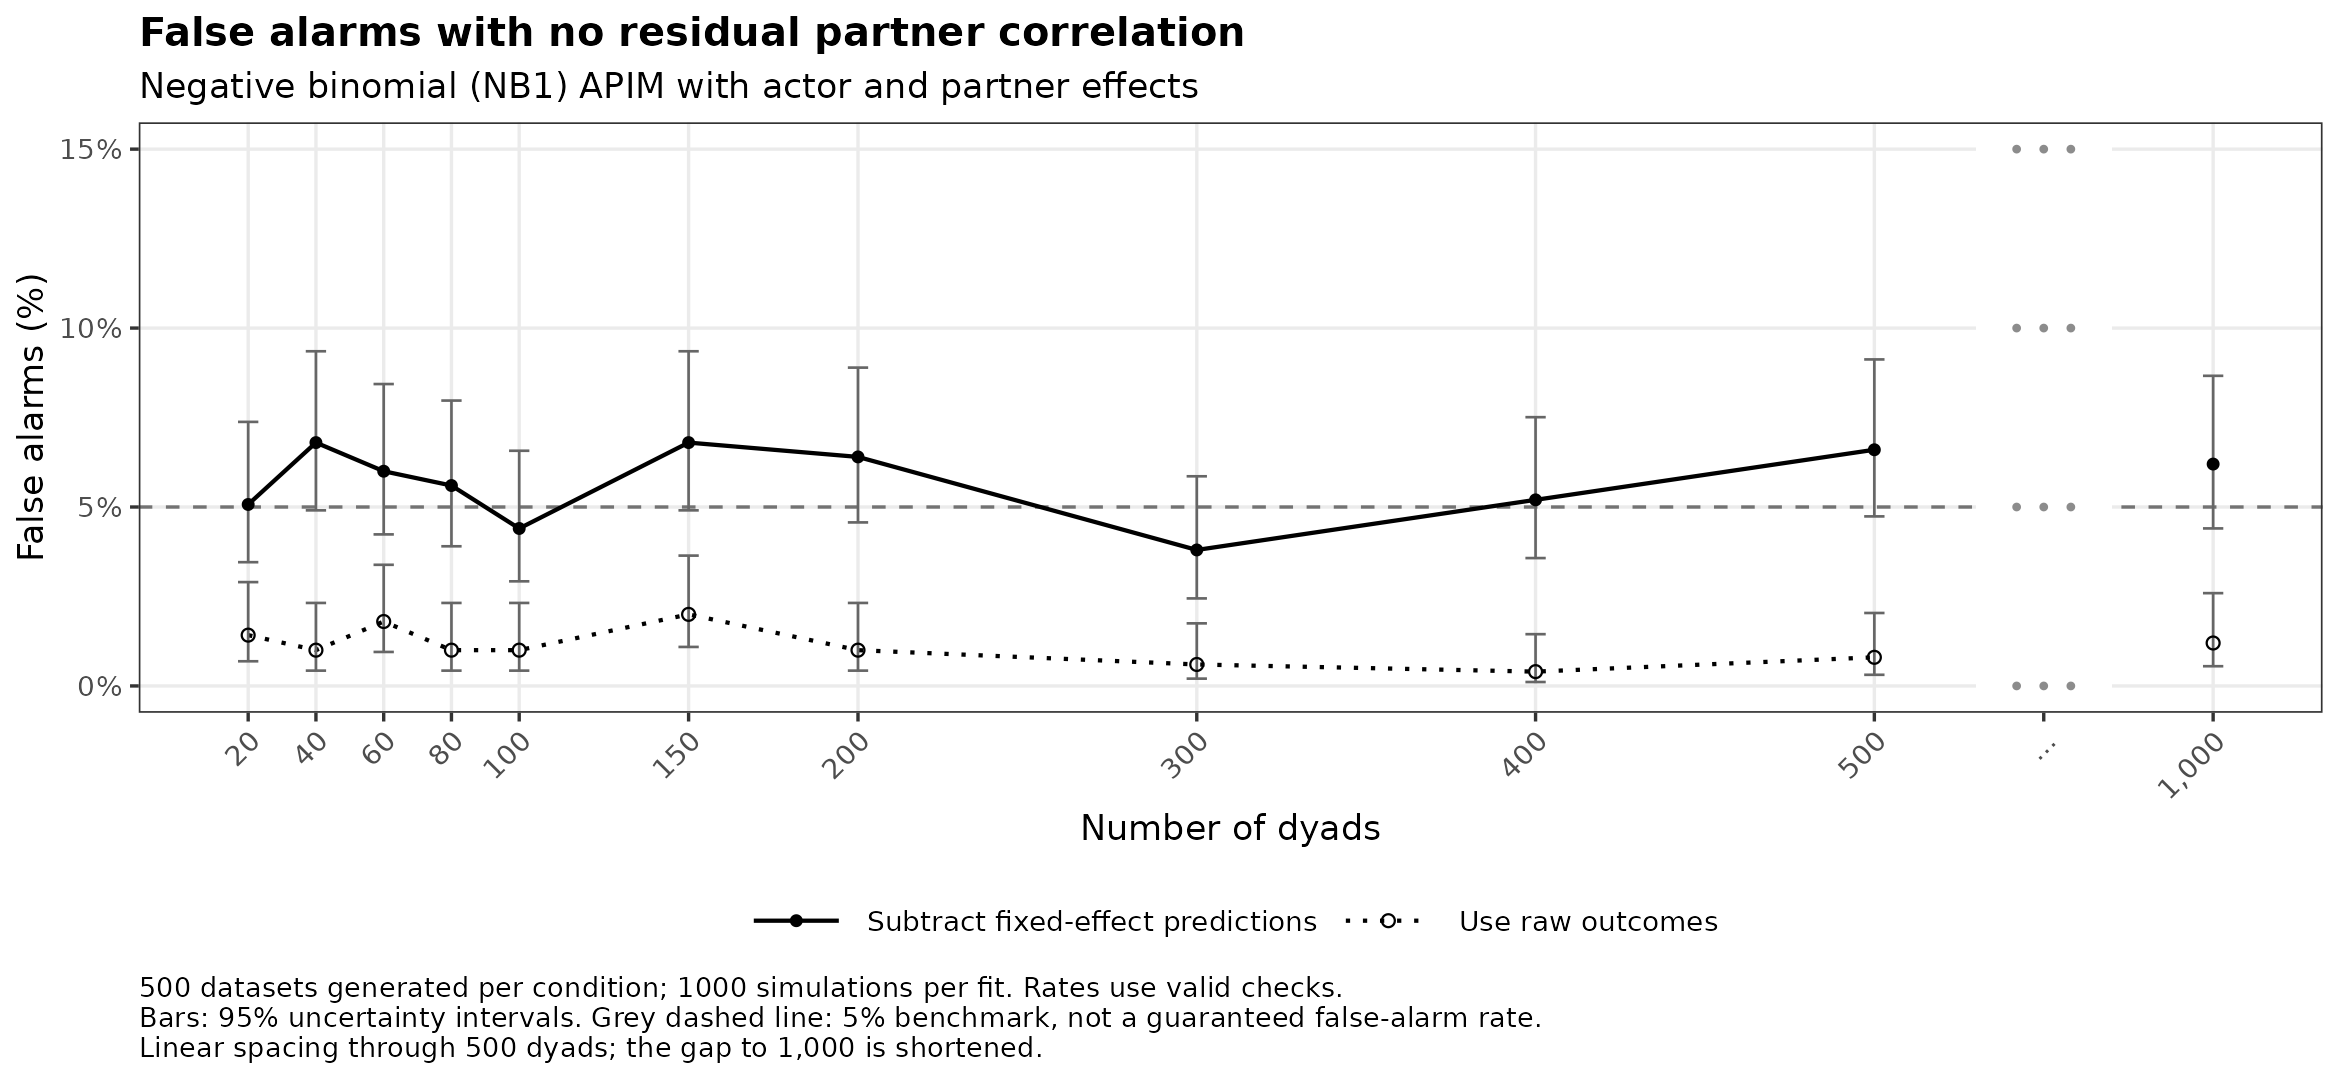
Model settings and checks
Fitted model:
outcome ~ actor_predictor + partner_predictor.
Mean: Actor effect 0.5, partner effect 0.3, log link, intercept 1.1.
Dispersion: phi = 1
Population correlations
Gaussian copula calibrated with 200000 pairs and independently verified with 500000 pairs.
| Target residual correlation | Verified correlation | Monte Carlo SE |
|---|---|---|
| 0.0 | 0.000 | 0.002 |
| 0.1 | 0.101 | 0.002 |
| 0.3 | 0.300 | 0.002 |
| 0.5 | 0.500 | 0.001 |
Opposite-direction flags with positive residual correlation
| Method | Datasets checked | Opposite-direction flags |
|---|---|---|
| model-centred | 16480 | 17 |
| raw | 16480 | 3 |
21973 of 22000 datasets produced reference simulations.
| Exclusion reason | Datasets |
|---|---|
| Convergence or Hessian problem | 27 |
Conditions with fewer usable checks
| Dyads | Residual correlation | Methods | Generated | Checked |
|---|---|---|---|---|
| 20 | 0.0 | model-centred, raw | 500 | 493 |
| 20 | 0.1 | model-centred, raw | 500 | 495 |
| 20 | 0.3 | model-centred, raw | 500 | 492 |
| 20 | 0.5 | model-centred, raw | 500 | 493 |
Counts for every plotted point are saved in the summary table.
Negative binomial (NB2)
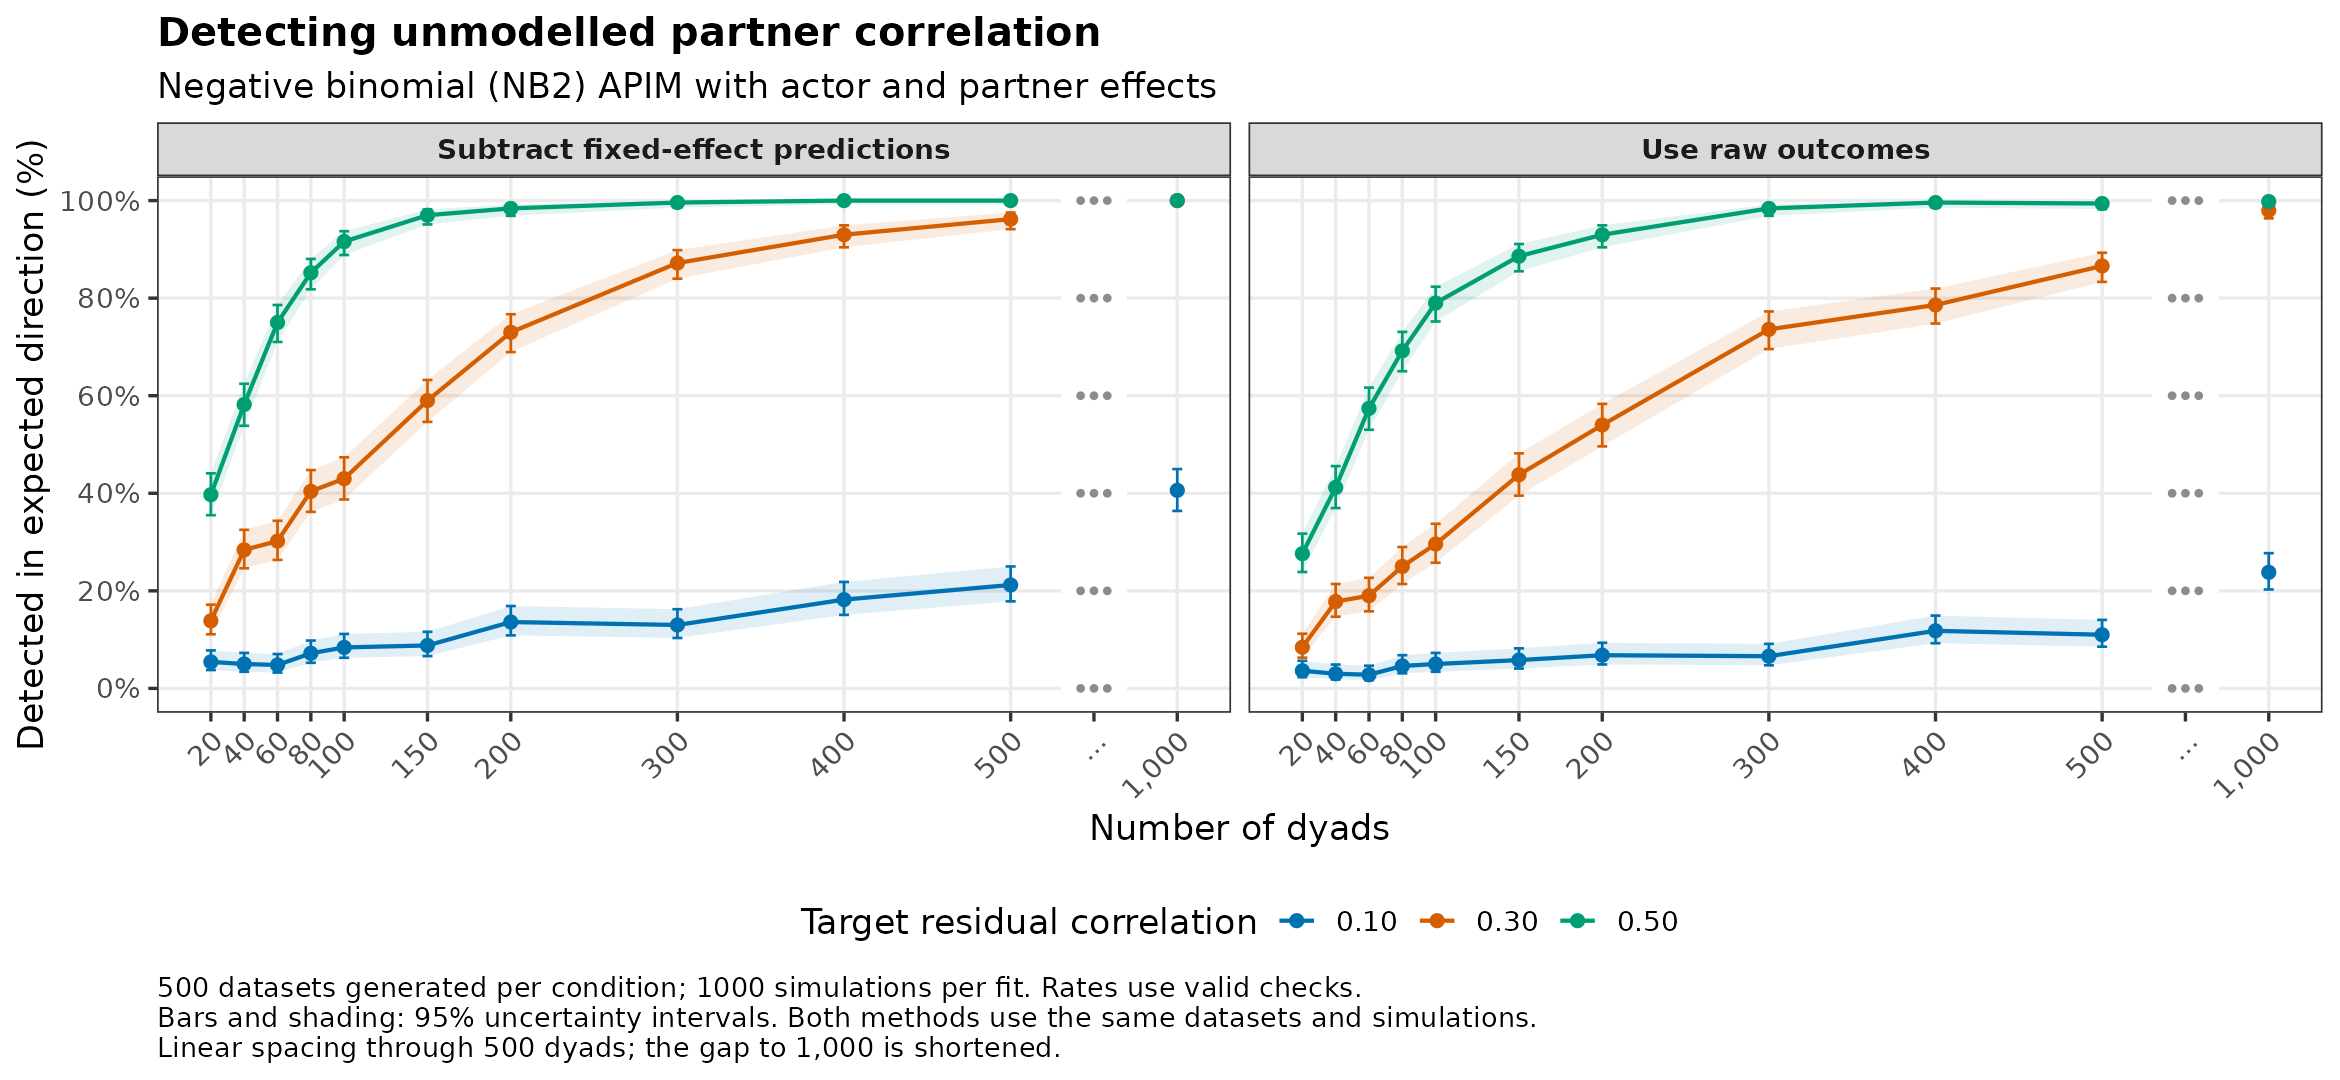
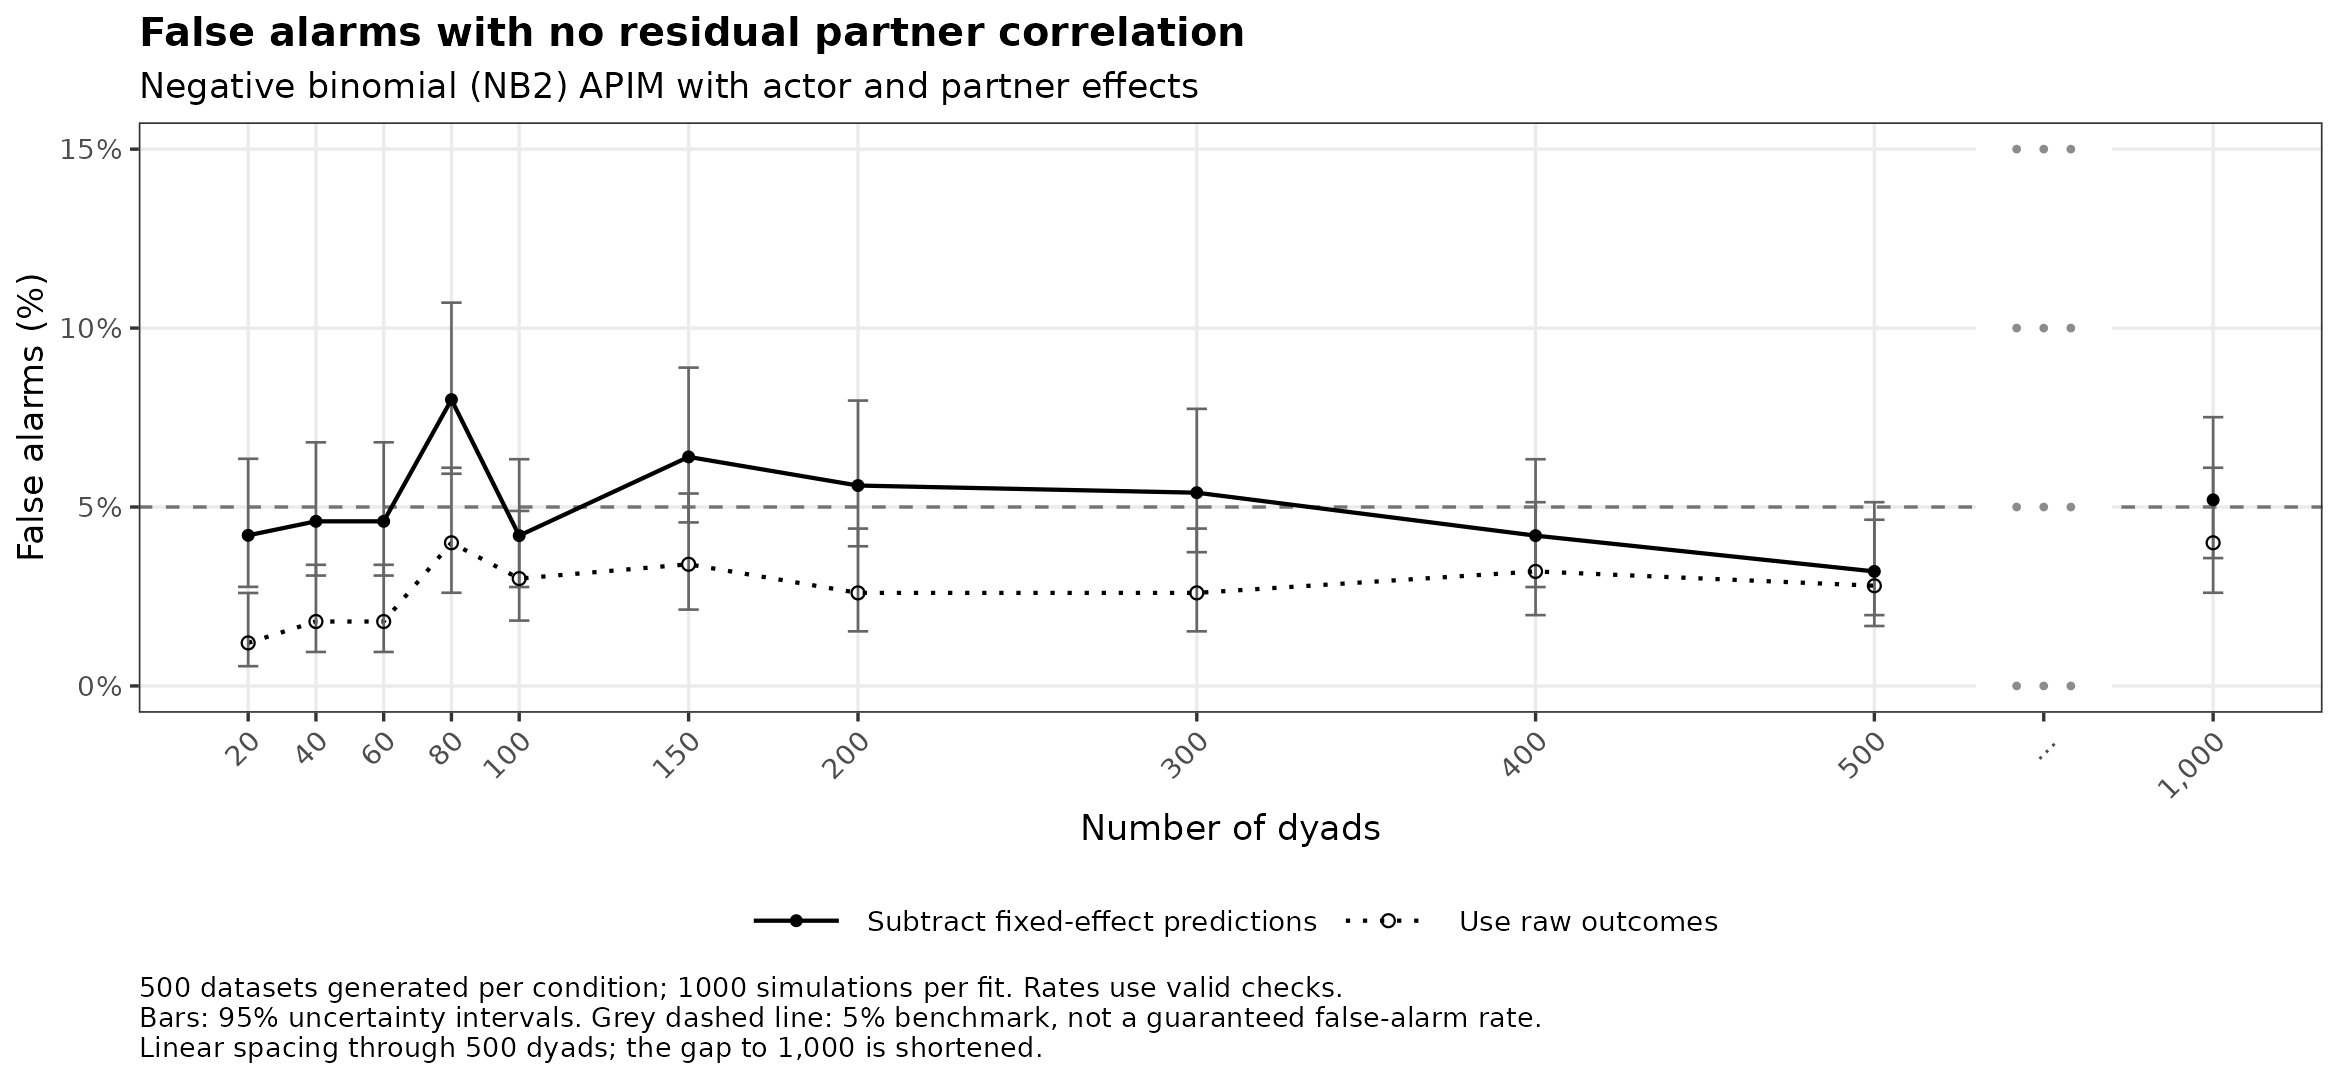
Model settings and checks
Fitted model:
outcome ~ actor_predictor + partner_predictor.
Mean: Actor effect 0.5, partner effect 0.3, log link, intercept 1.1.
Dispersion: size = 3
Population correlations
Gaussian copula calibrated with 200000 pairs and independently verified with 500000 pairs.
| Target residual correlation | Verified correlation | Monte Carlo SE |
|---|---|---|
| 0.0 | 0.003 | 0.003 |
| 0.1 | 0.097 | 0.003 |
| 0.3 | 0.297 | 0.003 |
| 0.5 | 0.497 | 0.002 |
Opposite-direction flags with positive residual correlation
| Method | Datasets checked | Opposite-direction flags |
|---|---|---|
| model-centred | 16491 | 26 |
| raw | 16491 | 7 |
21990 of 22000 datasets produced reference simulations.
| Exclusion reason | Datasets |
|---|---|
| Convergence or Hessian problem | 10 |
Conditions with fewer usable checks
| Dyads | Residual correlation | Methods | Generated | Checked |
|---|---|---|---|---|
| 20 | 0.0 | model-centred, raw | 500 | 499 |
| 20 | 0.1 | model-centred, raw | 500 | 497 |
| 20 | 0.3 | model-centred, raw | 500 | 498 |
| 20 | 0.5 | model-centred, raw | 500 | 496 |
Counts for every plotted point are saved in the summary table.
Negative binomial (NB12)
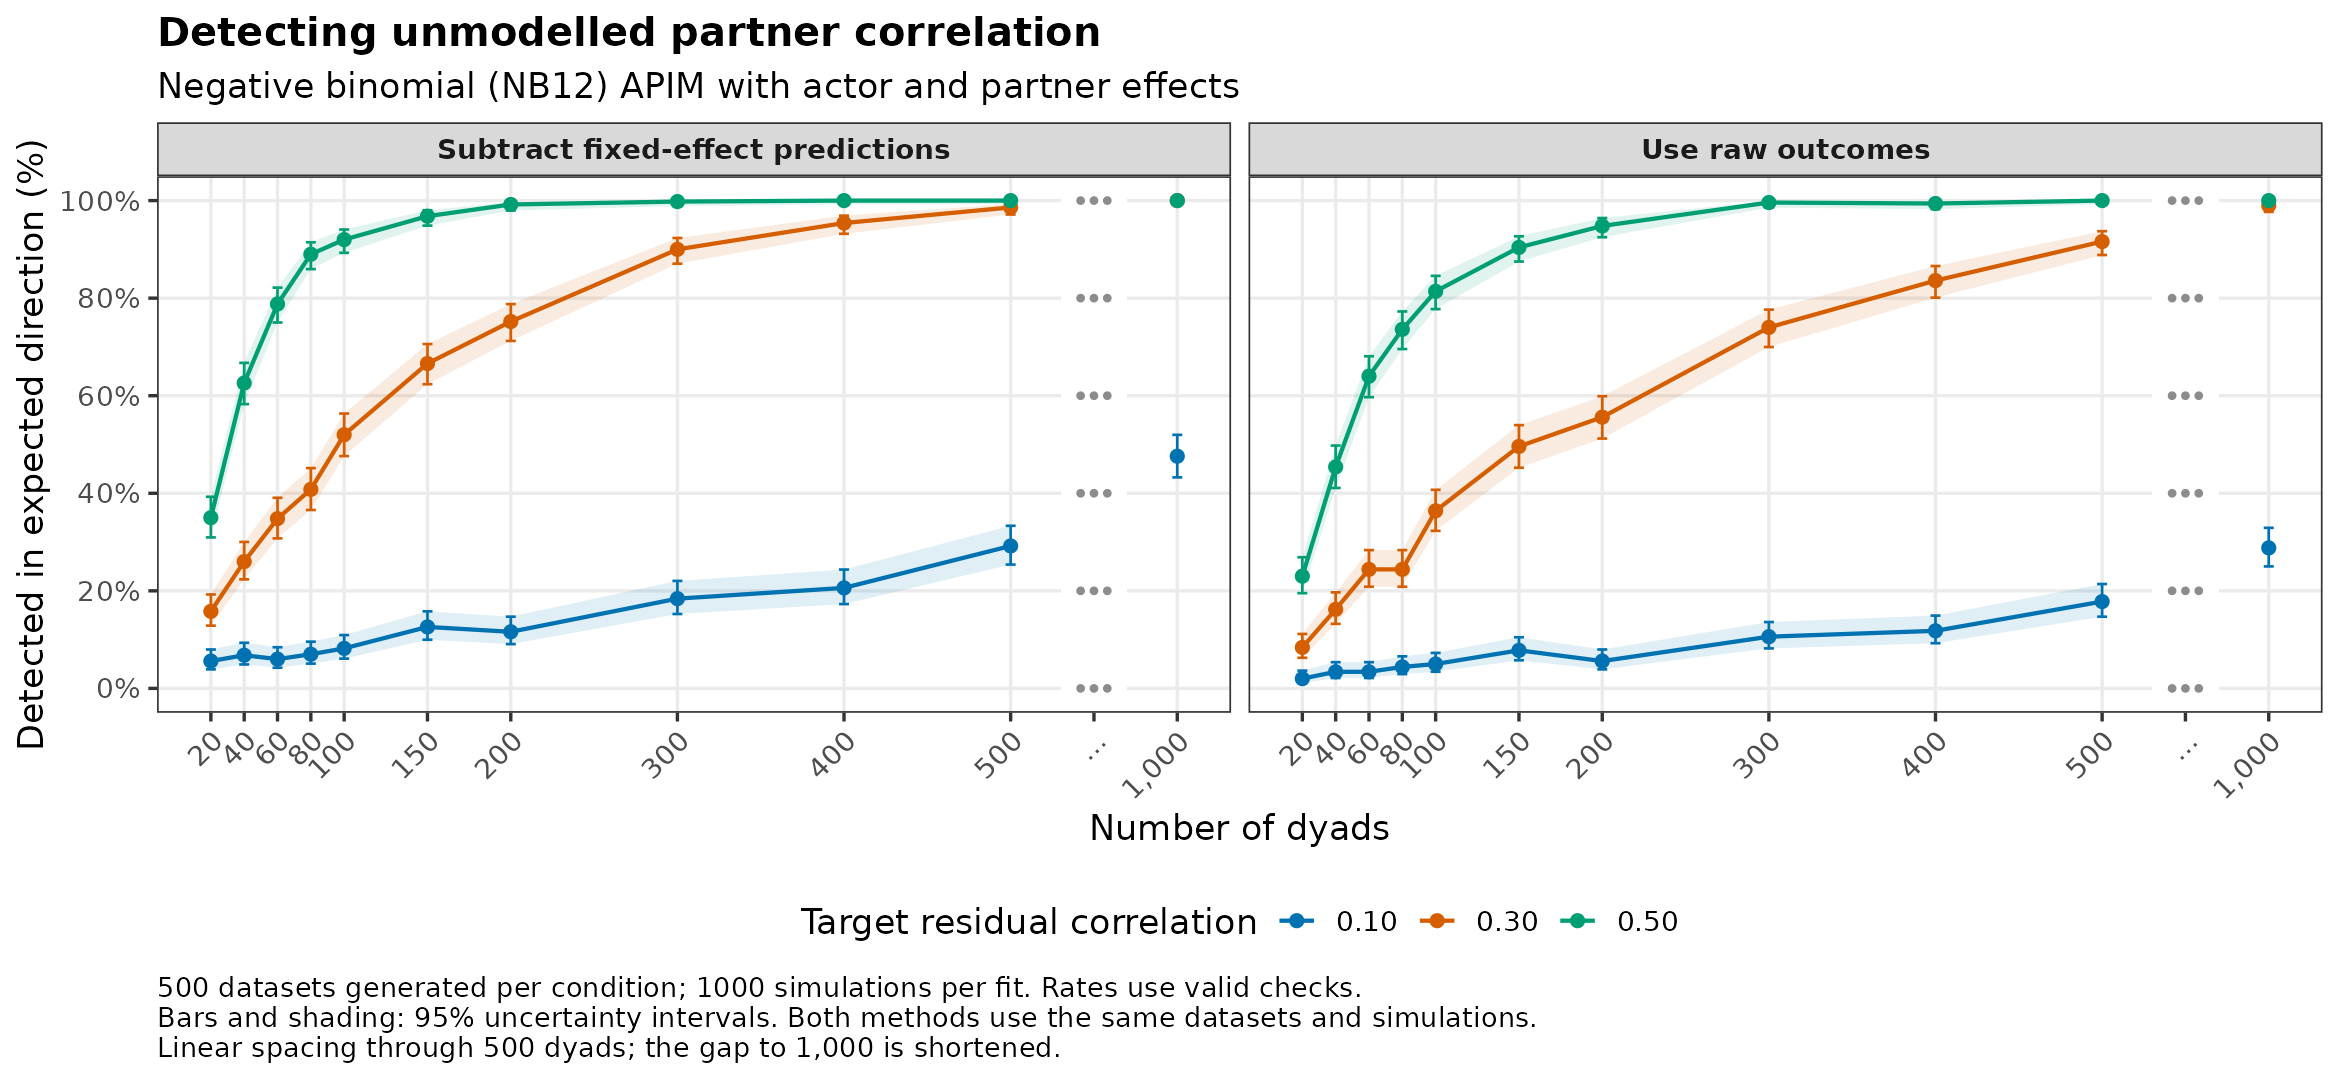
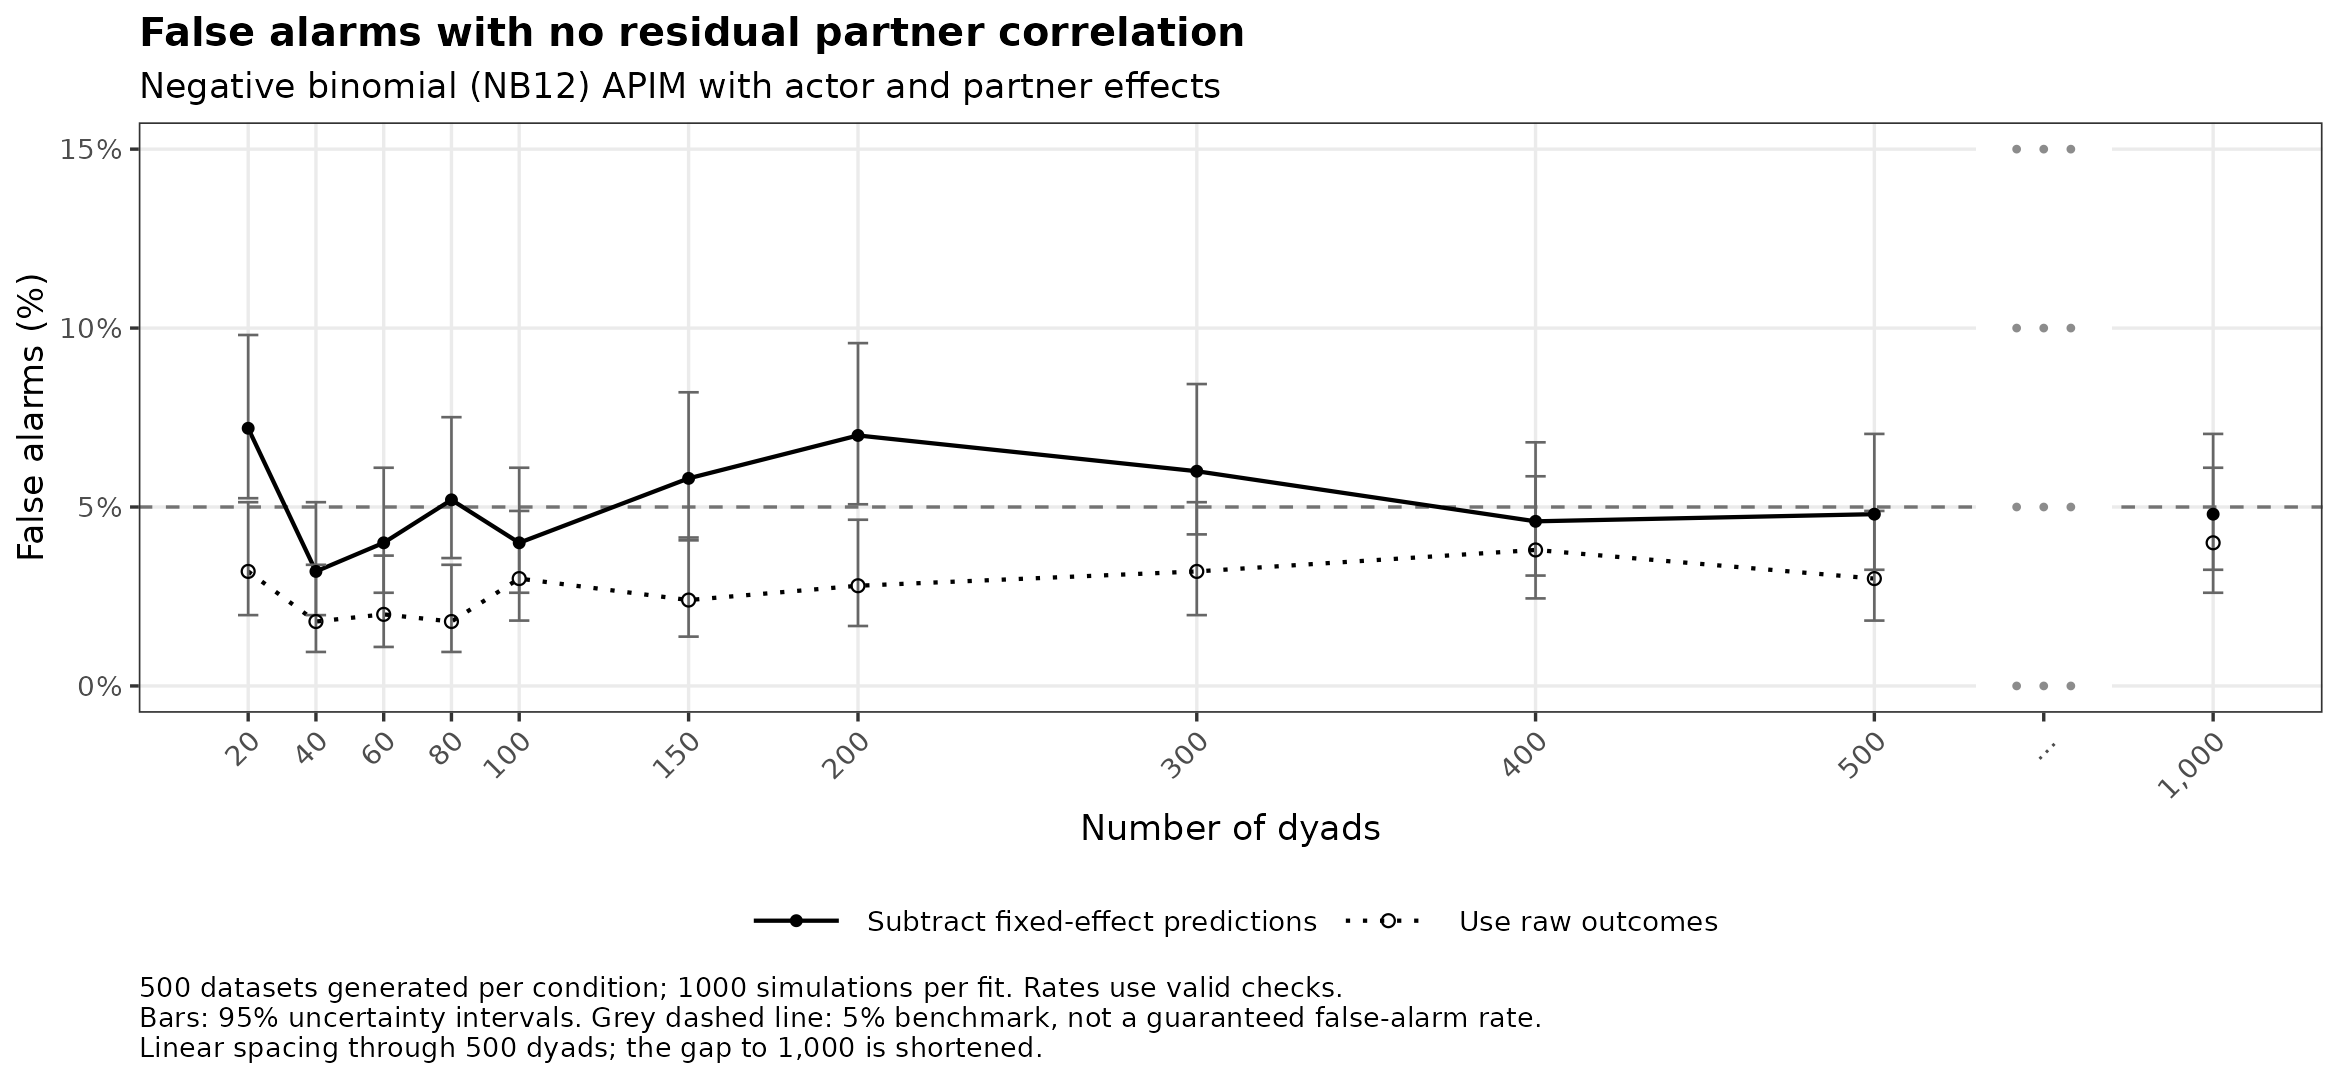
Model settings and checks
Fitted model:
outcome ~ actor_predictor + partner_predictor.
Mean: Actor effect 0.5, partner effect 0.3, log link, intercept 1.1.
Dispersion: phi = 1, psi = 3
Population correlations
Gaussian copula calibrated with 200000 pairs and independently verified with 500000 pairs.
| Target residual correlation | Verified correlation | Monte Carlo SE |
|---|---|---|
| 0.0 | 0.000 | 0.002 |
| 0.1 | 0.096 | 0.002 |
| 0.3 | 0.296 | 0.002 |
| 0.5 | 0.497 | 0.002 |
Opposite-direction flags with positive residual correlation
| Method | Datasets checked | Opposite-direction flags |
|---|---|---|
| model-centred | 16500 | 27 |
| raw | 16500 | 4 |
22000 of 22000 datasets produced reference simulations.
Counts for every plotted point are saved in the summary table.
COM-Poisson
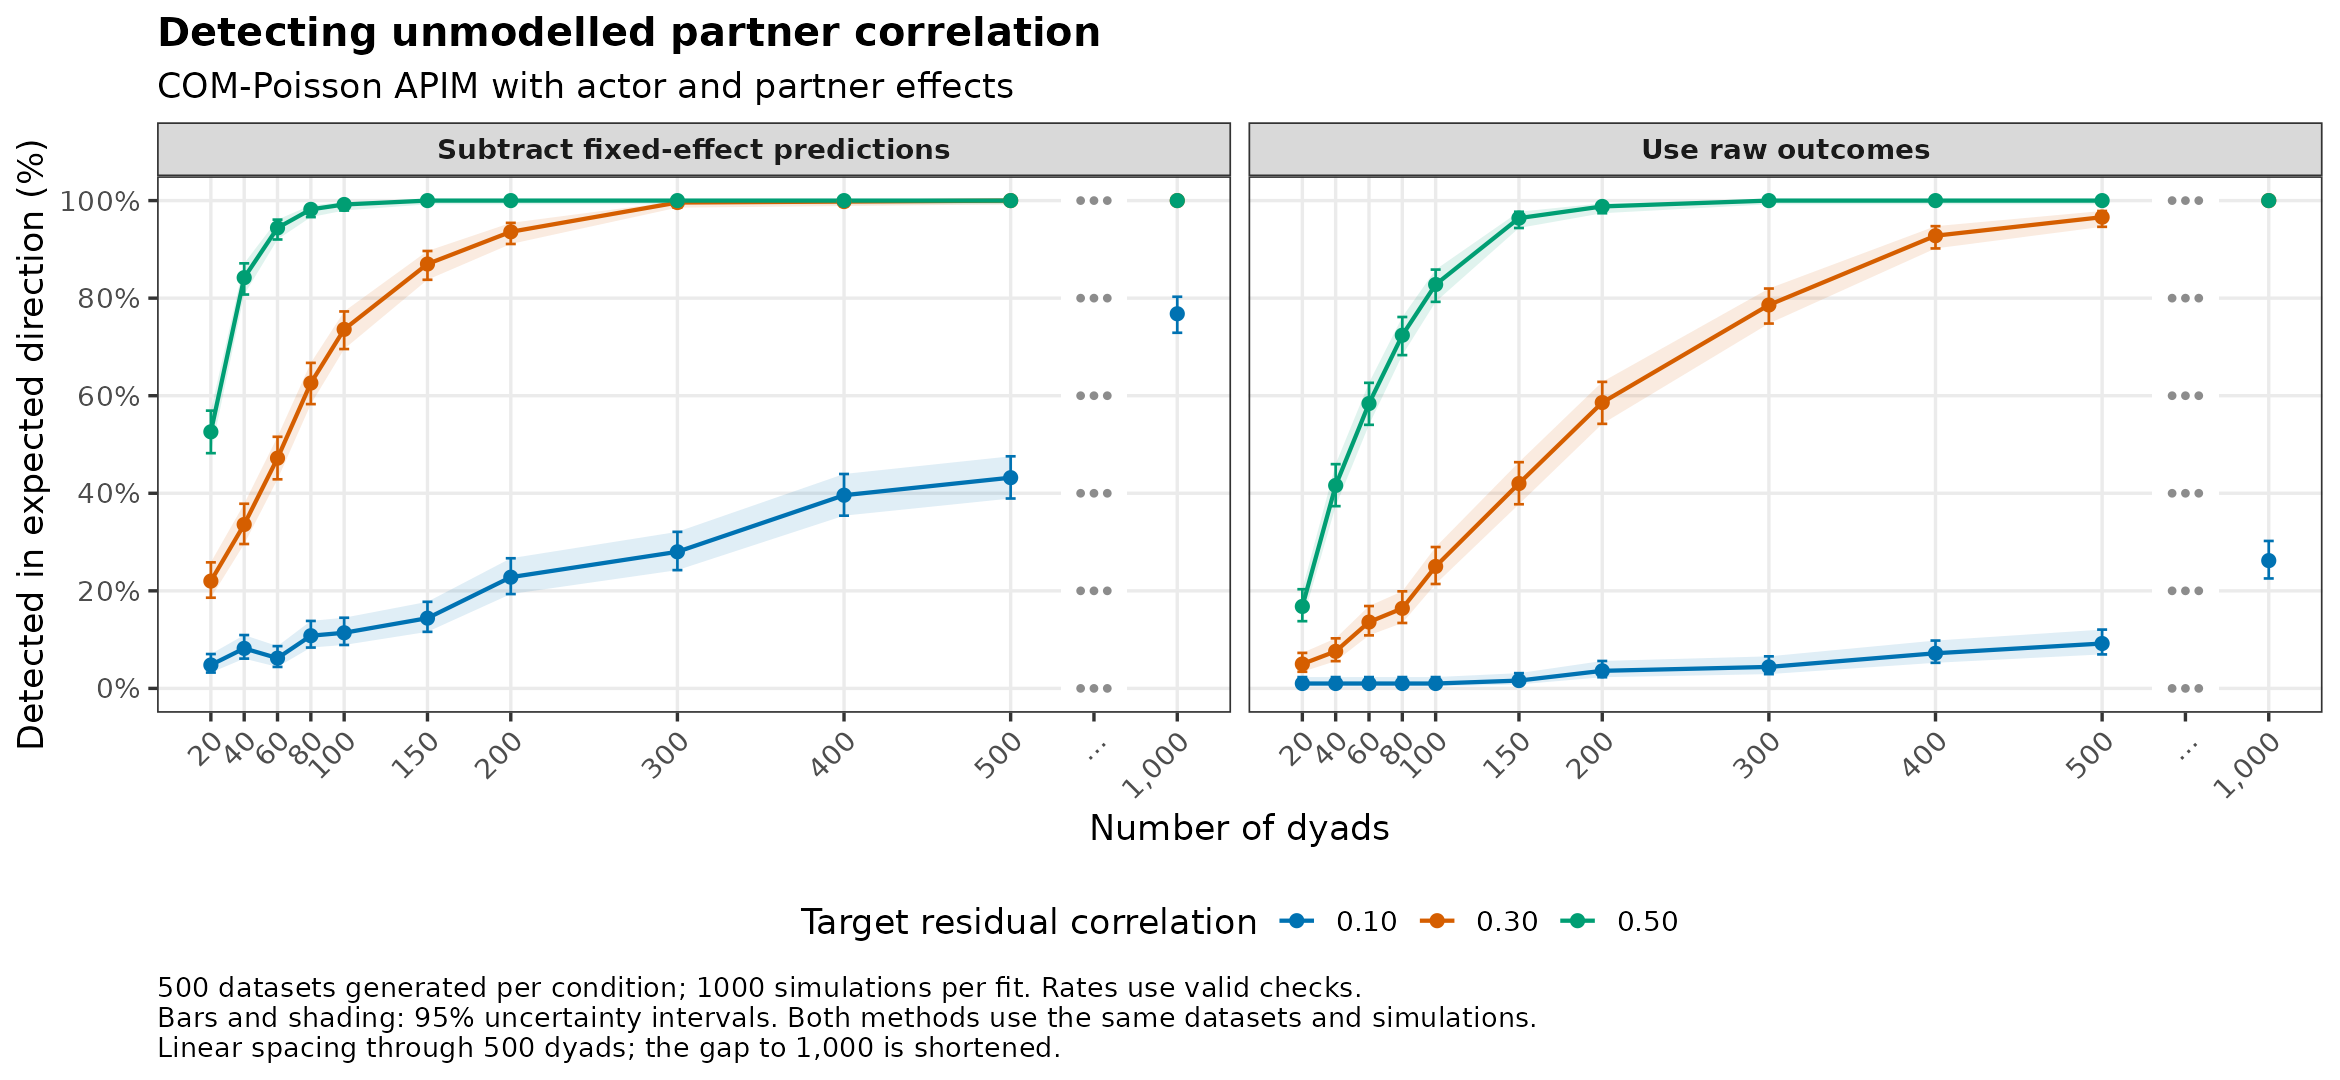
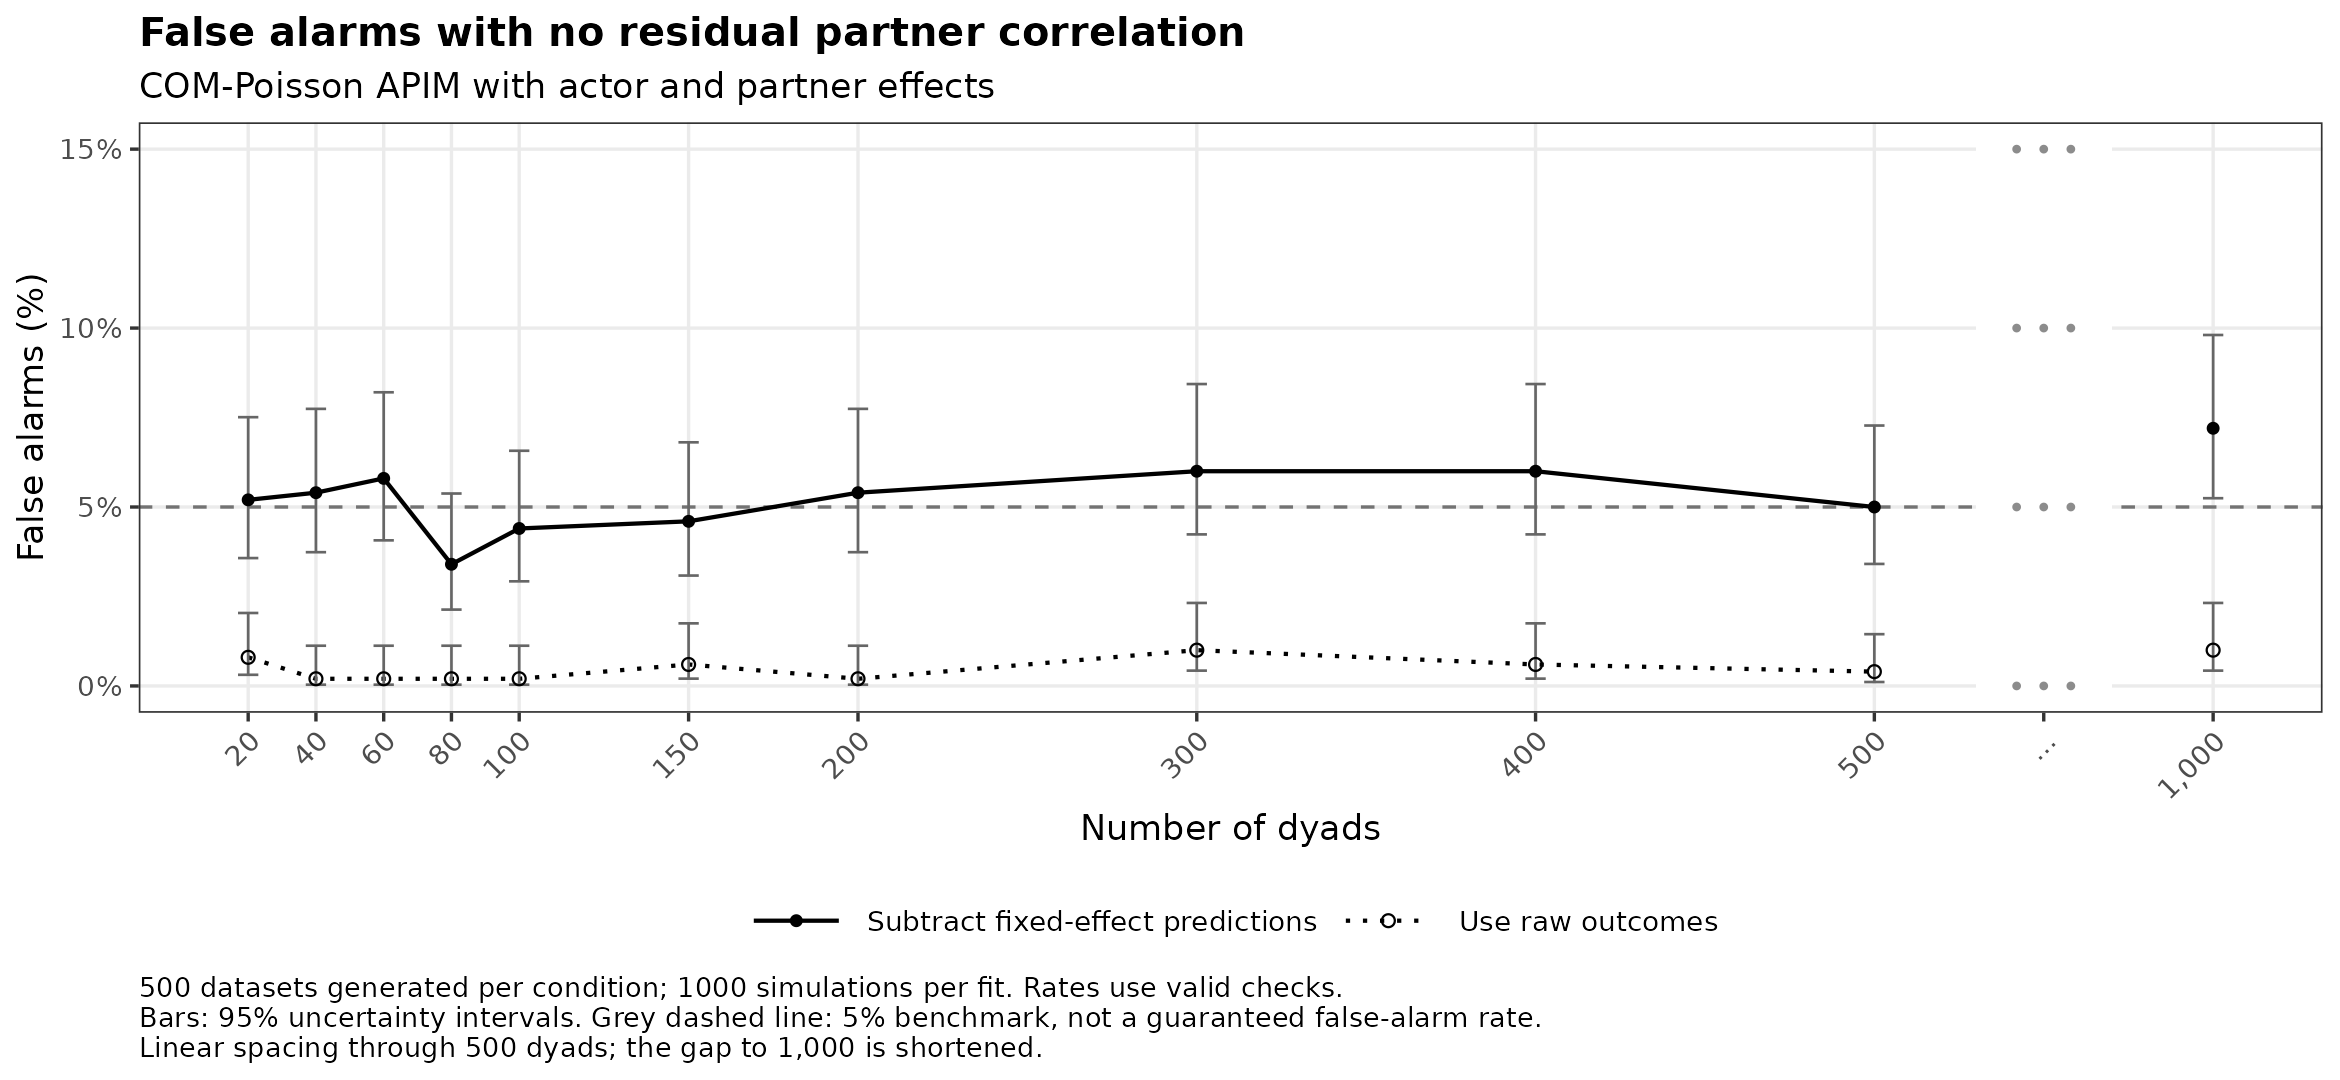
Model settings and checks
Fitted model:
outcome ~ actor_predictor + partner_predictor.
Mean: Actor effect 0.5, partner effect 0.3, log link, intercept 1.1.
Dispersion: phi = 0.5 (nu = 2)
Population correlations
Gaussian copula calibrated with 200000 pairs and independently verified with 500000 pairs.
| Target residual correlation | Verified correlation | Monte Carlo SE |
|---|---|---|
| 0.0 | -0.002 | 0.002 |
| 0.1 | 0.097 | 0.002 |
| 0.3 | 0.298 | 0.002 |
| 0.5 | 0.499 | 0.001 |
Opposite-direction flags with positive residual correlation
| Method | Datasets checked | Opposite-direction flags |
|---|---|---|
| model-centred | 16499 | 27 |
| raw | 16499 | 4 |
21999 of 22000 datasets produced reference simulations.
| Exclusion reason | Datasets |
|---|---|
| Check failed | 1 |
Conditions with fewer usable checks
| Dyads | Residual correlation | Methods | Generated | Checked |
|---|---|---|---|---|
| 1000 | 0.3 | model-centred, raw | 500 | 499 |
Counts for every plotted point are saved in the summary table.
Generalized Poisson
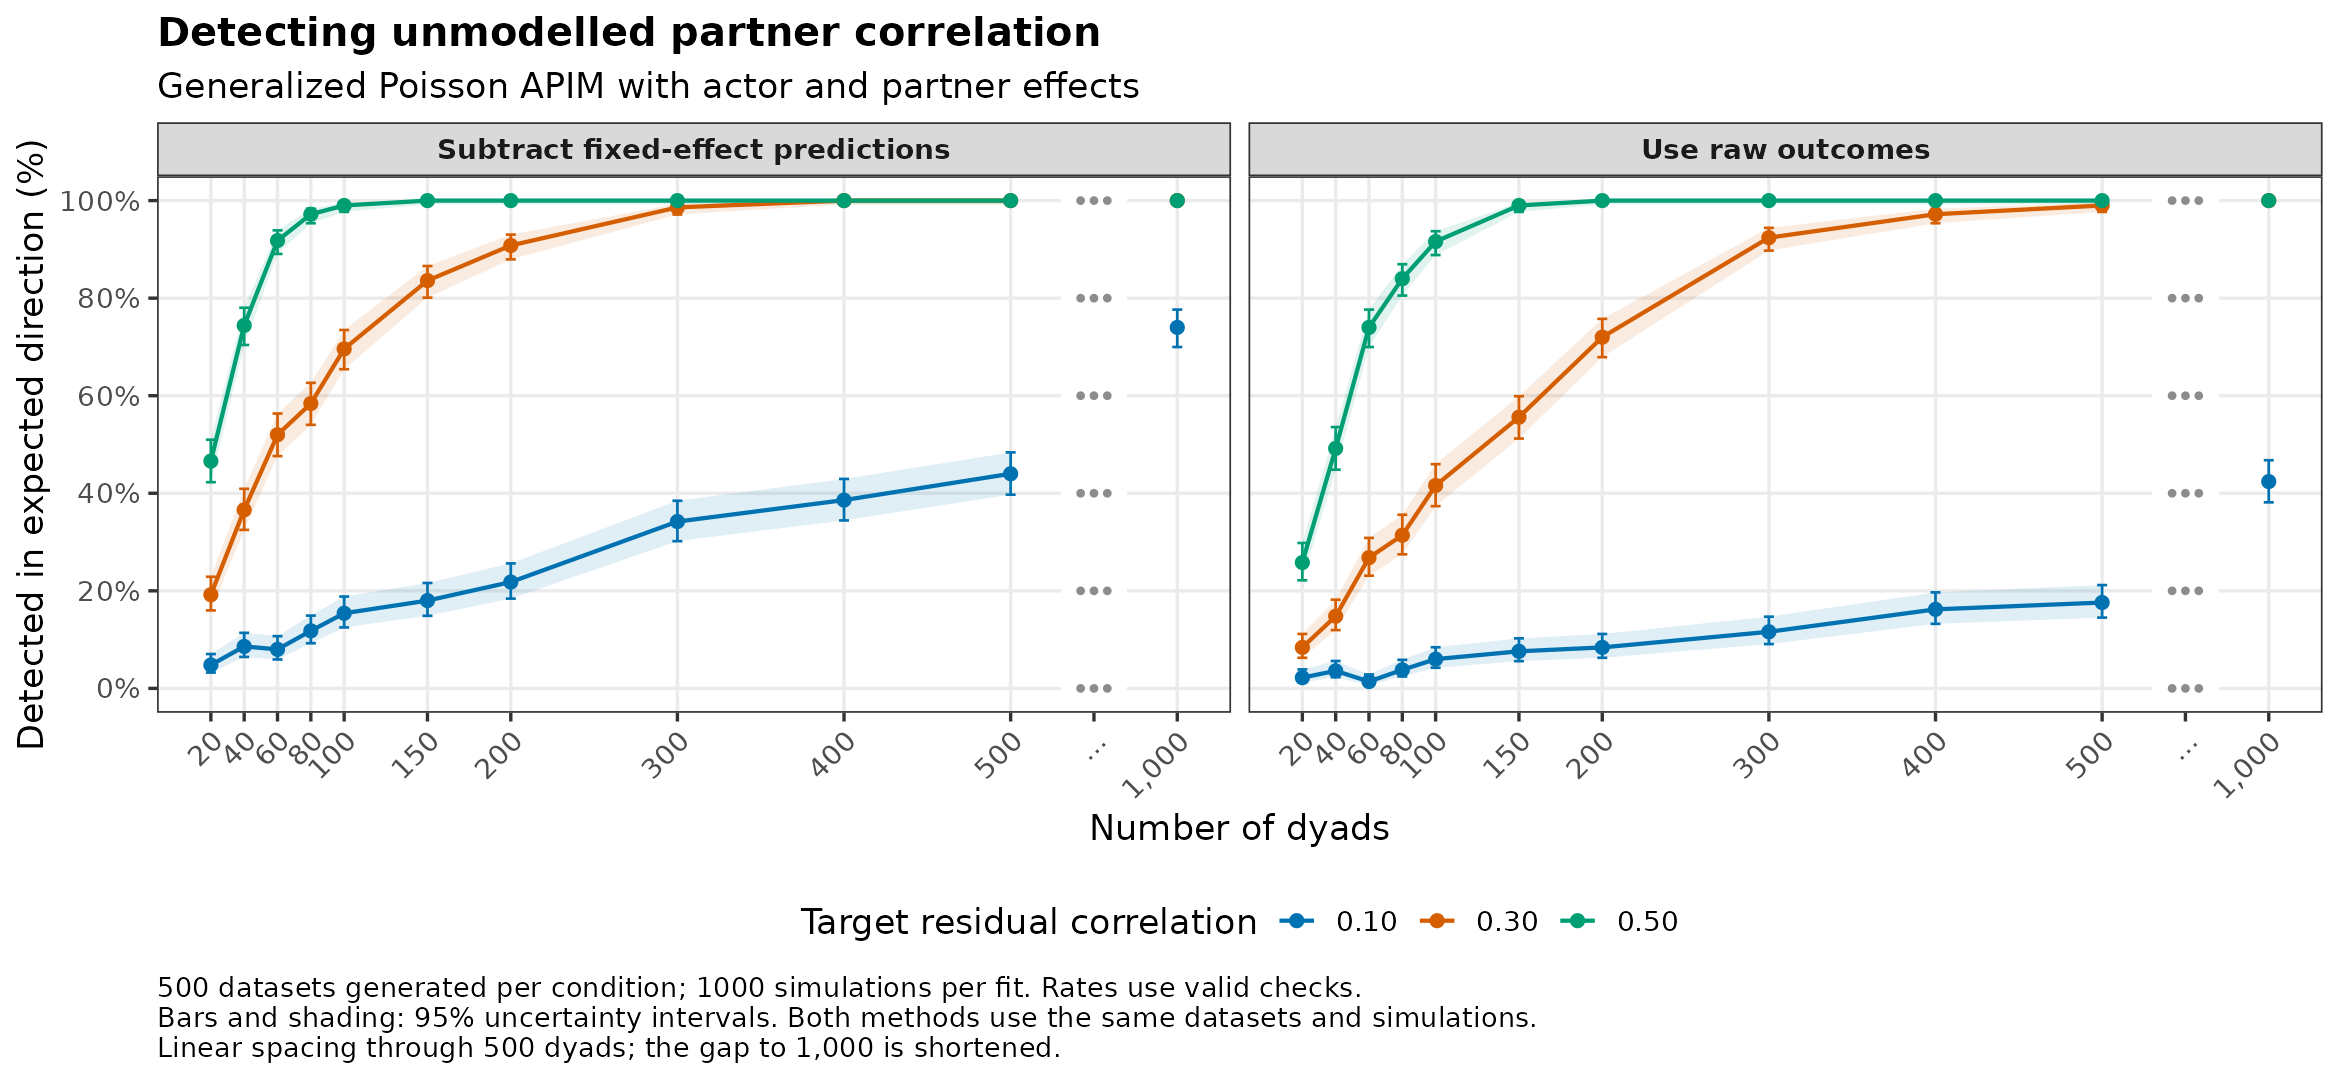
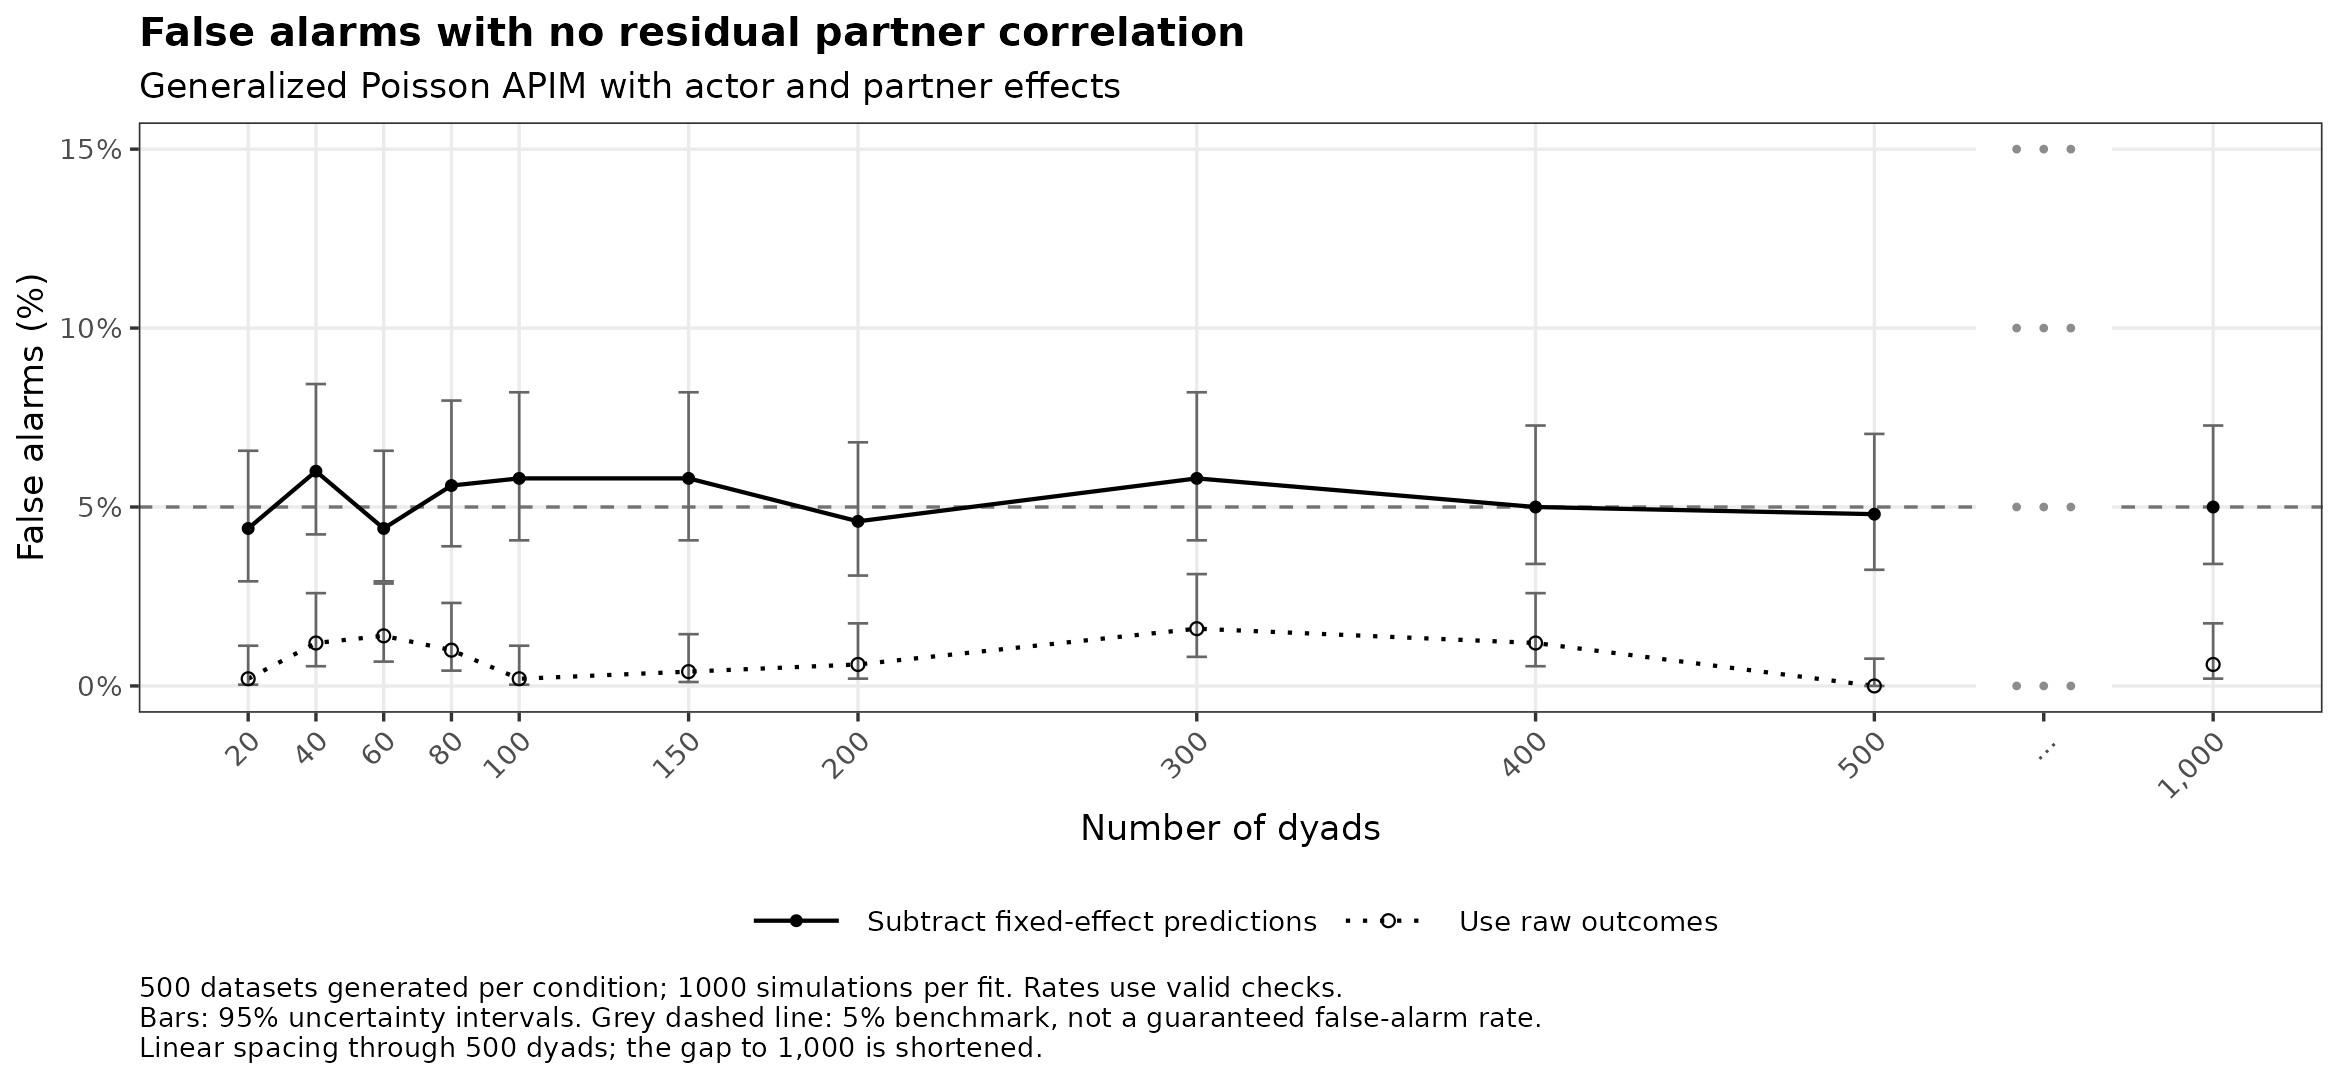
Model settings and checks
Fitted model:
outcome ~ actor_predictor + partner_predictor.
Mean: Actor effect 0.5, partner effect 0.3, log link, intercept 1.1.
Dispersion: phi = 2
Population correlations
Gaussian copula calibrated with 200000 pairs and independently verified with 500000 pairs.
| Target residual correlation | Verified correlation | Monte Carlo SE |
|---|---|---|
| 0.0 | 0.000 | 0.002 |
| 0.1 | 0.102 | 0.002 |
| 0.3 | 0.303 | 0.002 |
| 0.5 | 0.502 | 0.001 |
Opposite-direction flags with positive residual correlation
| Method | Datasets checked | Opposite-direction flags |
|---|---|---|
| model-centred | 16500 | 12 |
| raw | 16500 | 0 |
22000 of 22000 datasets produced reference simulations.
Counts for every plotted point are saved in the summary table.
Zero-truncated Poisson
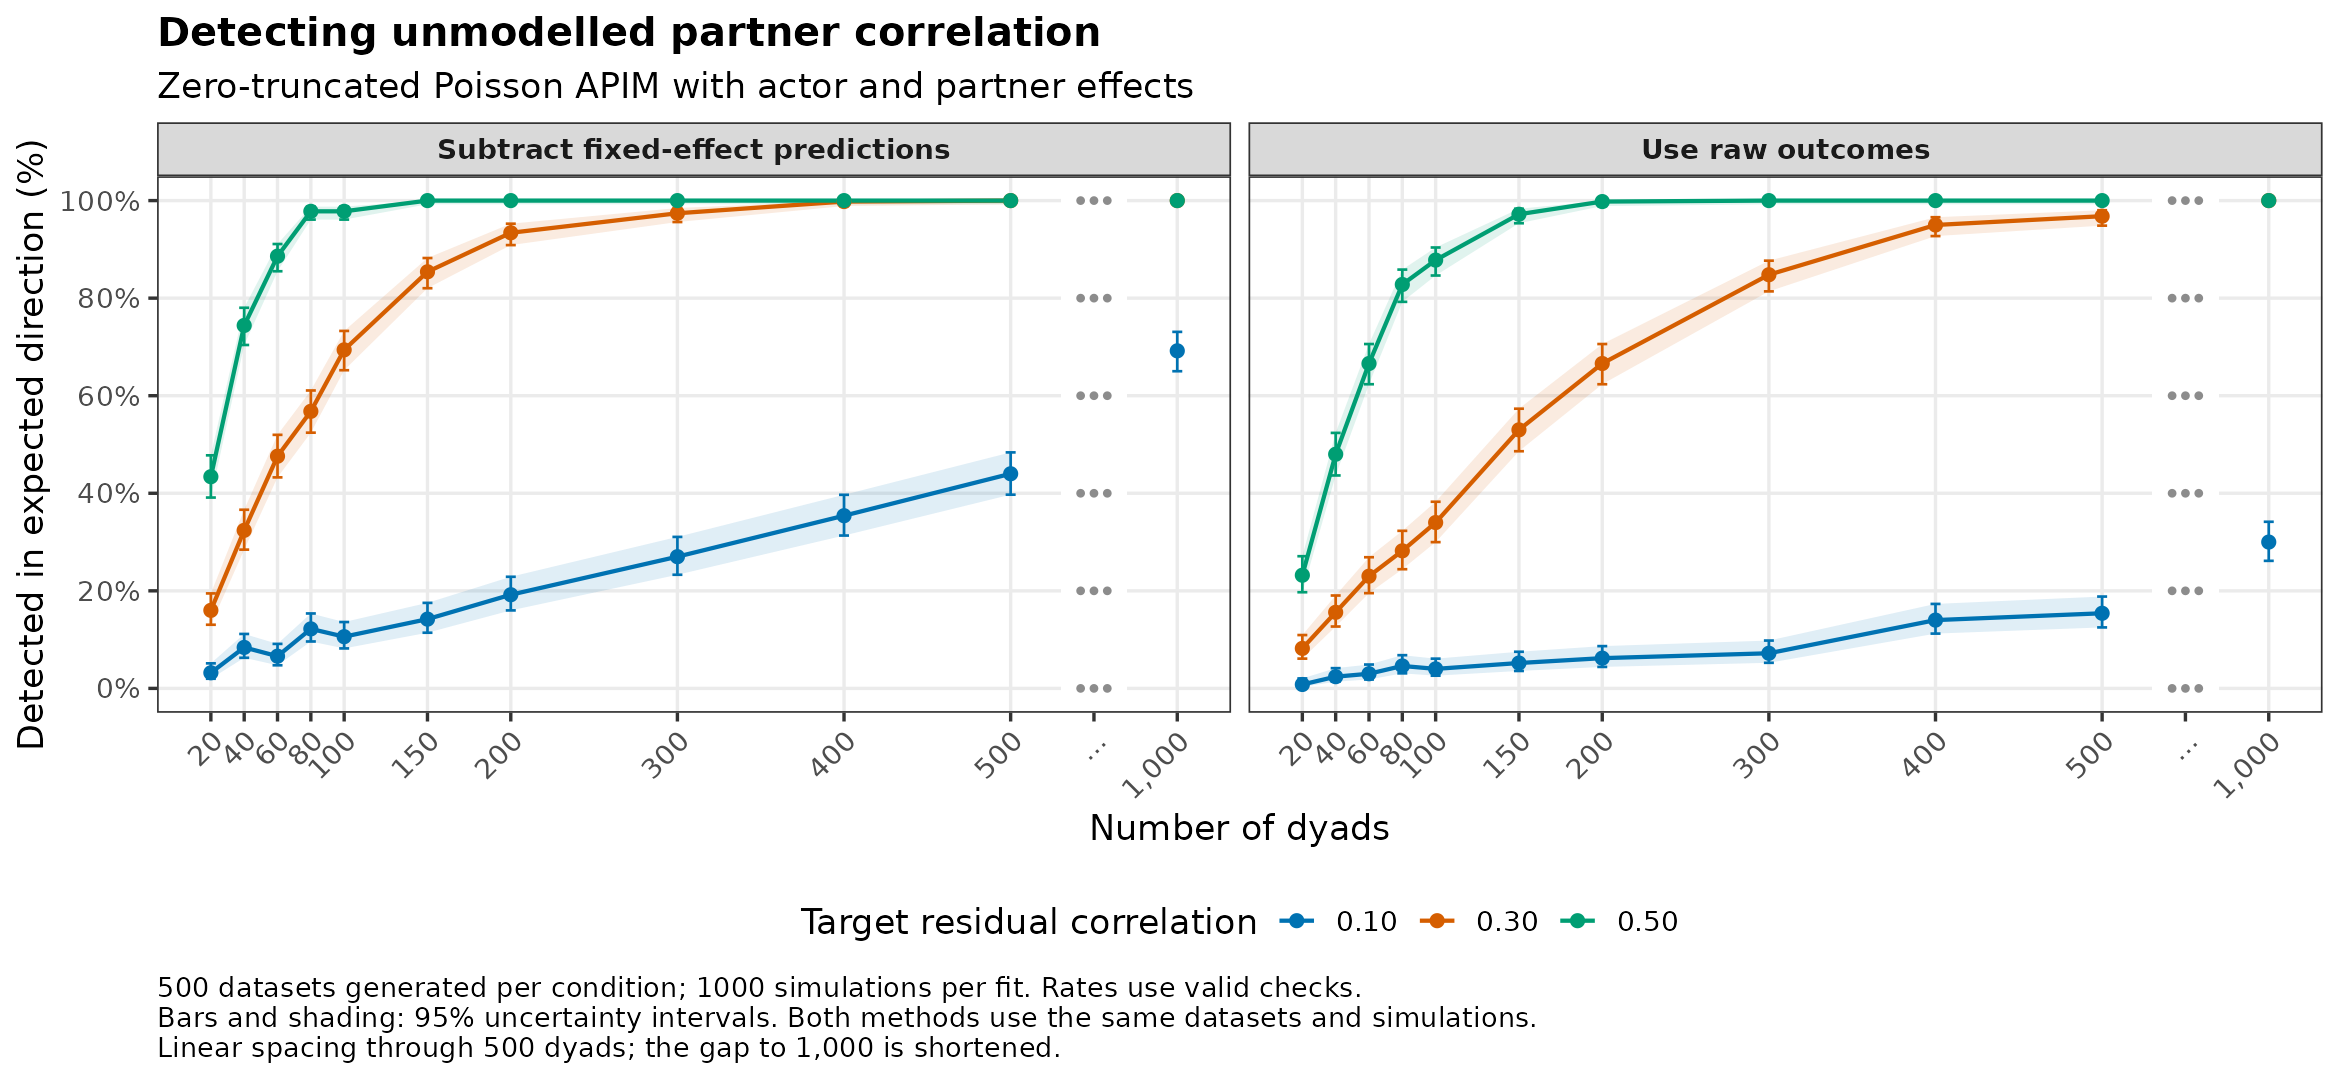
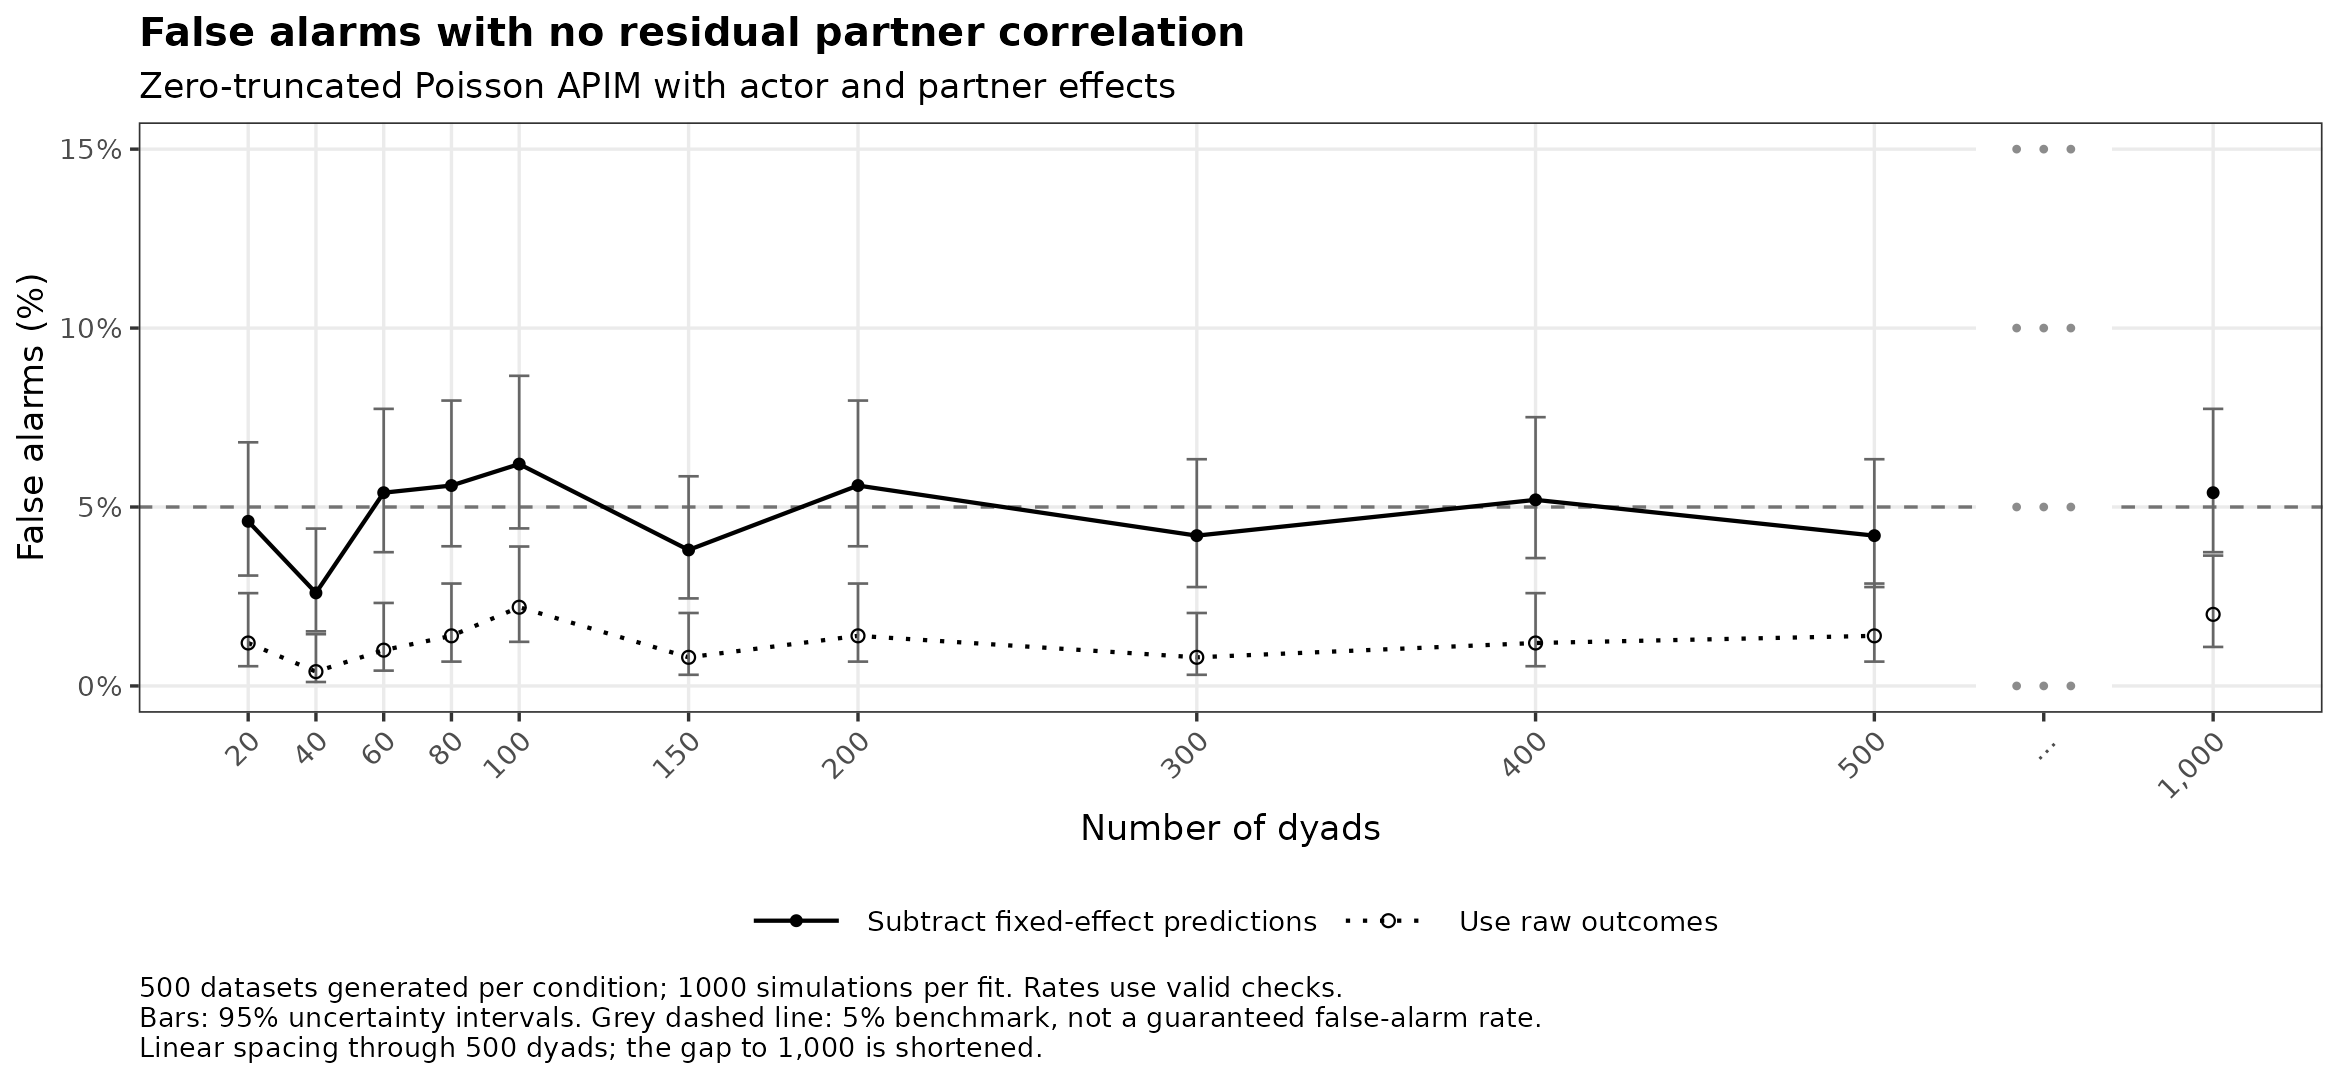
Model settings and checks
Fitted model:
outcome ~ actor_predictor + partner_predictor.
Mean: Actor effect 0.5, partner effect 0.3, log link, intercept 1.1.
Dispersion: Poisson mean, truncated at zero
Population correlations
Gaussian copula calibrated with 200000 pairs and independently verified with 500000 pairs.
| Target residual correlation | Verified correlation | Monte Carlo SE |
|---|---|---|
| 0.0 | -0.001 | 0.002 |
| 0.1 | 0.102 | 0.002 |
| 0.3 | 0.302 | 0.002 |
| 0.5 | 0.500 | 0.001 |
Opposite-direction flags with positive residual correlation
| Method | Datasets checked | Opposite-direction flags |
|---|---|---|
| model-centred | 16500 | 19 |
| raw | 16500 | 3 |
22000 of 22000 datasets produced reference simulations.
Counts for every plotted point are saved in the summary table.
Zero-truncated NB1
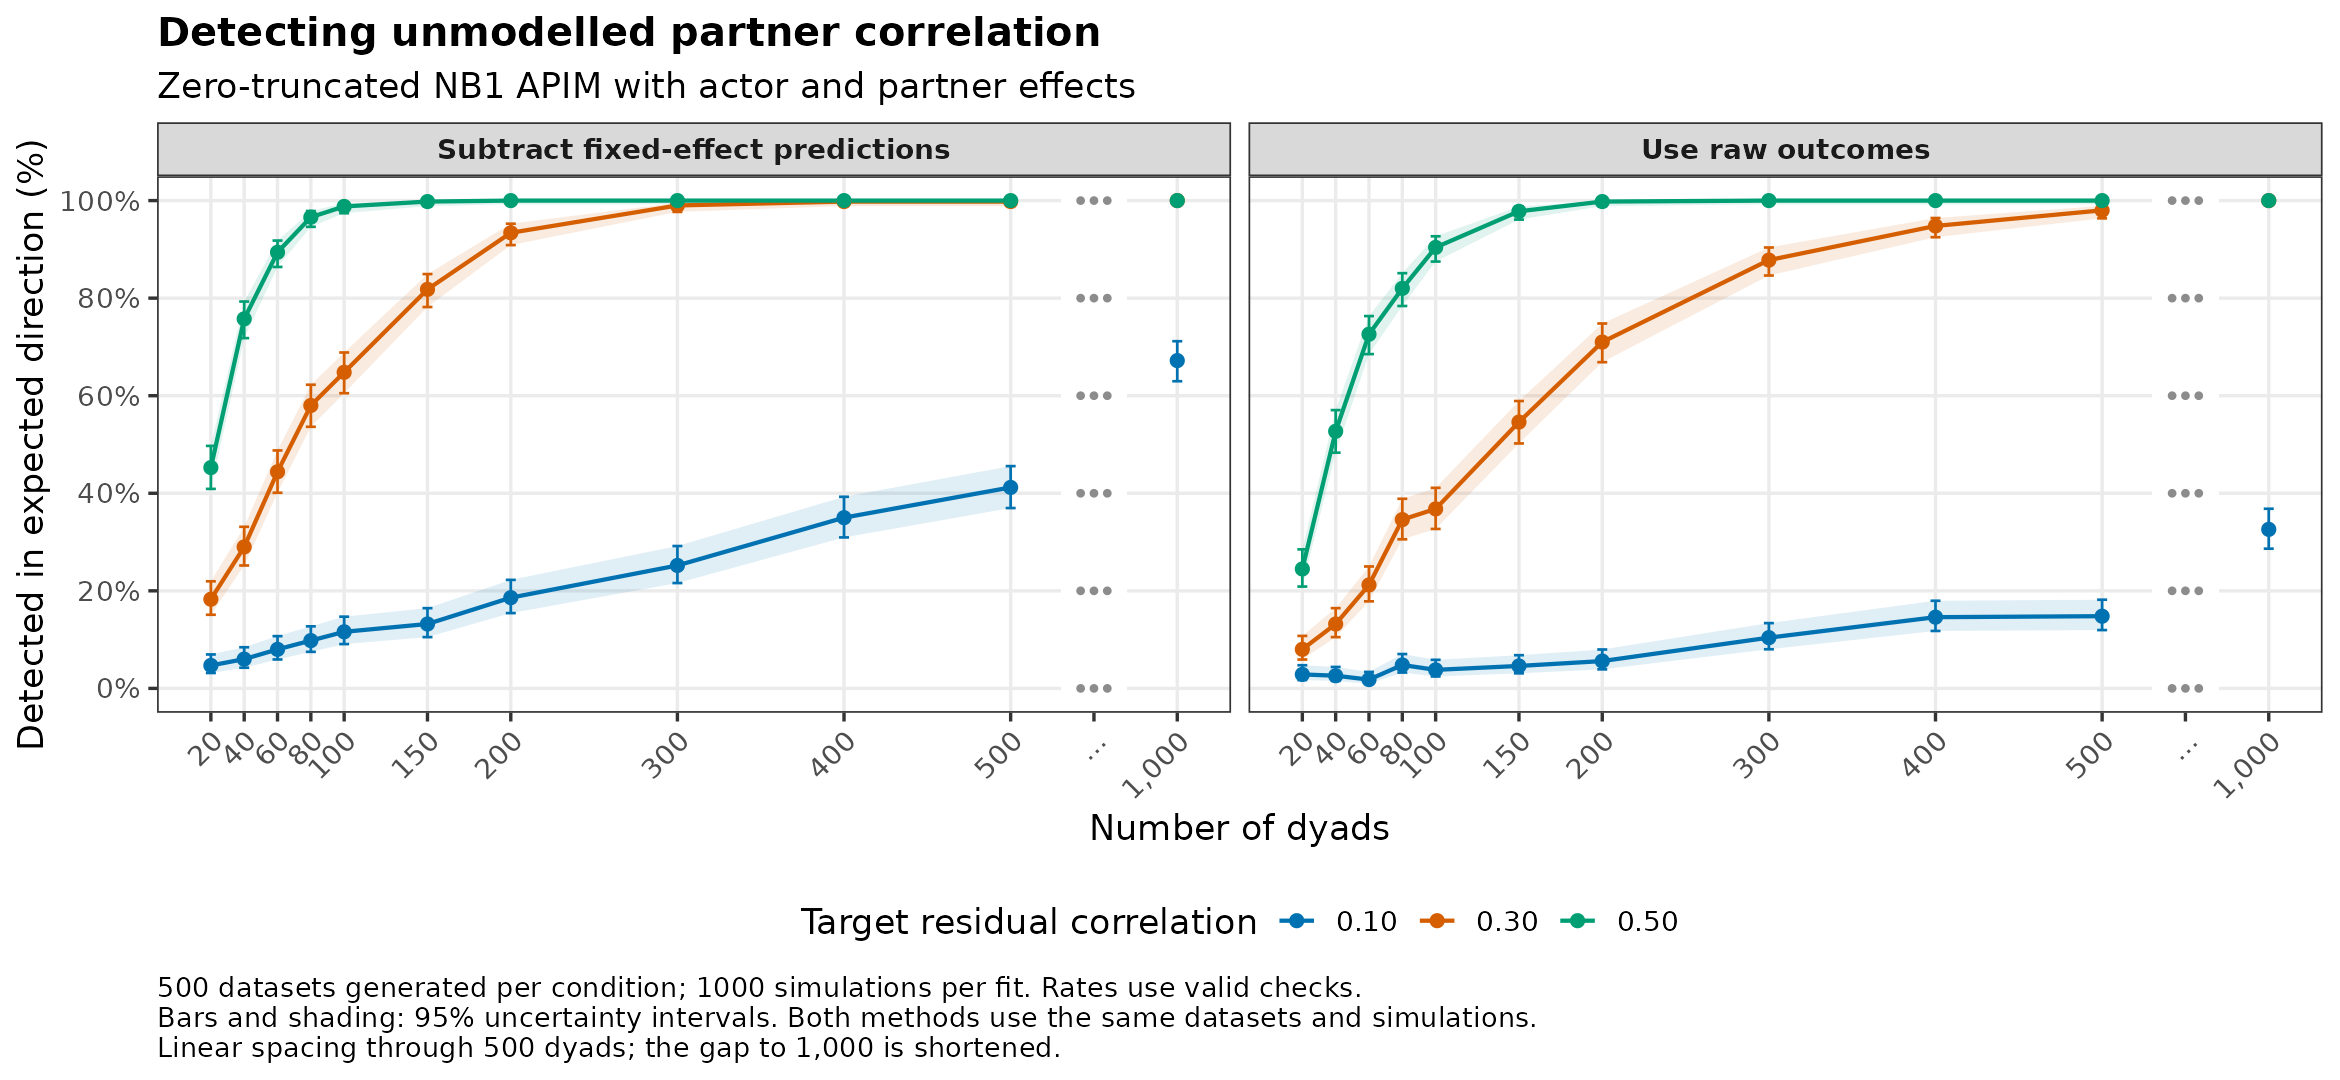
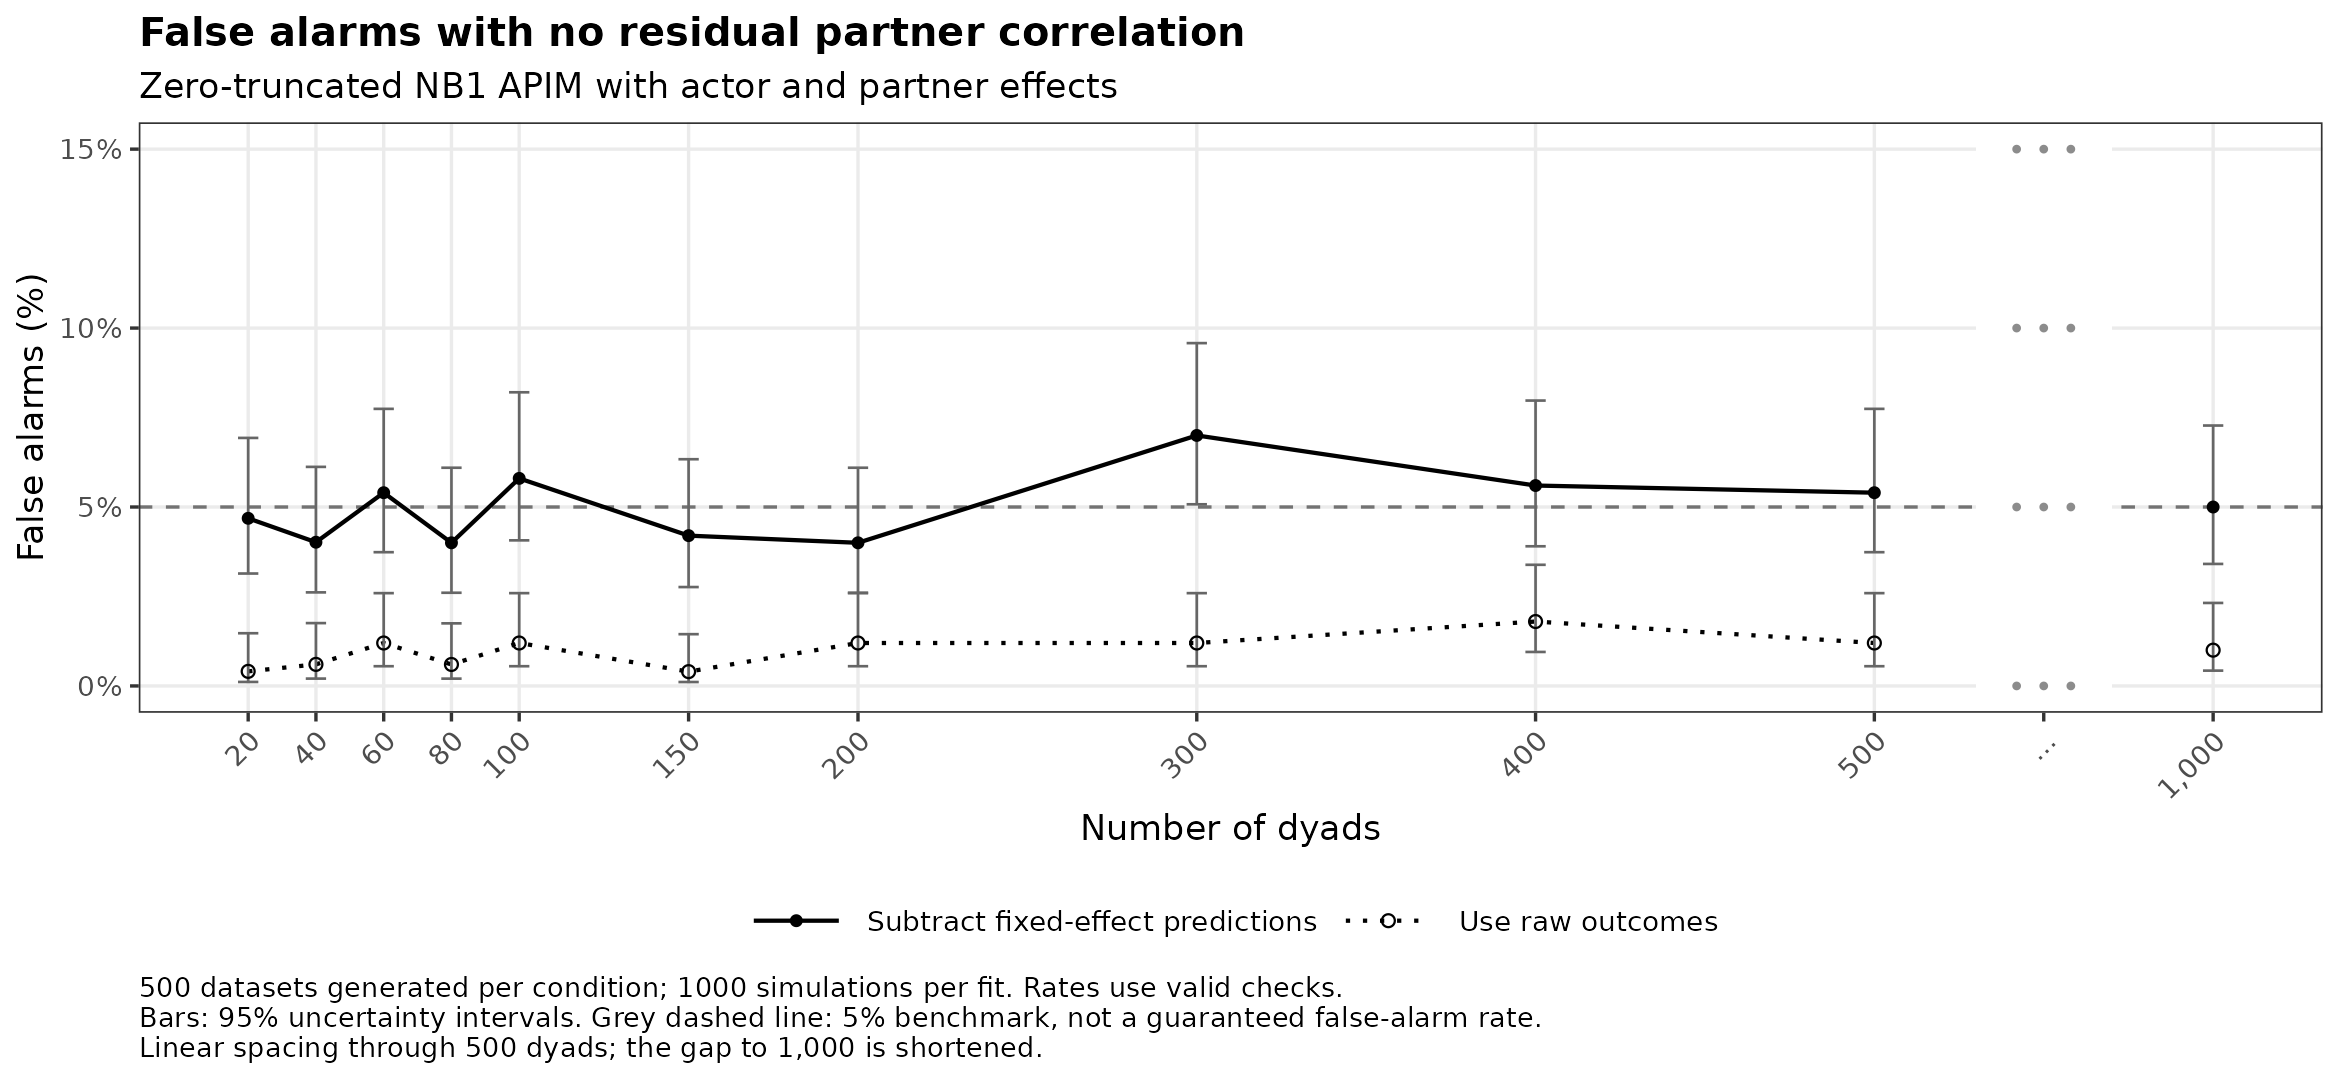
Model settings and checks
Fitted model:
outcome ~ actor_predictor + partner_predictor.
Mean: Actor effect 0.5, partner effect 0.3, log link, intercept 1.1.
Dispersion: phi = 1, truncated at zero
Population correlations
Gaussian copula calibrated with 200000 pairs and independently verified with 500000 pairs.
| Target residual correlation | Verified correlation | Monte Carlo SE |
|---|---|---|
| 0.0 | -0.003 | 0.002 |
| 0.1 | 0.096 | 0.002 |
| 0.3 | 0.298 | 0.002 |
| 0.5 | 0.499 | 0.001 |
Opposite-direction flags with positive residual correlation
| Method | Datasets checked | Opposite-direction flags |
|---|---|---|
| model-centred | 16461 | 32 |
| raw | 16461 | 2 |
21950 of 22000 datasets produced reference simulations.
| Exclusion reason | Datasets |
|---|---|
| Convergence or Hessian problem | 50 |
Conditions with fewer usable checks
| Dyads | Residual correlation | Methods | Generated | Checked |
|---|---|---|---|---|
| 20 | 0.0 | model-centred, raw | 500 | 491 |
| 20 | 0.1 | model-centred, raw | 500 | 489 |
| 20 | 0.3 | model-centred, raw | 500 | 487 |
| 20 | 0.5 | model-centred, raw | 500 | 486 |
| 40 | 0.0 | model-centred, raw | 500 | 498 |
| 40 | 0.5 | model-centred, raw | 500 | 499 |
Counts for every plotted point are saved in the summary table.
Zero-truncated NB2
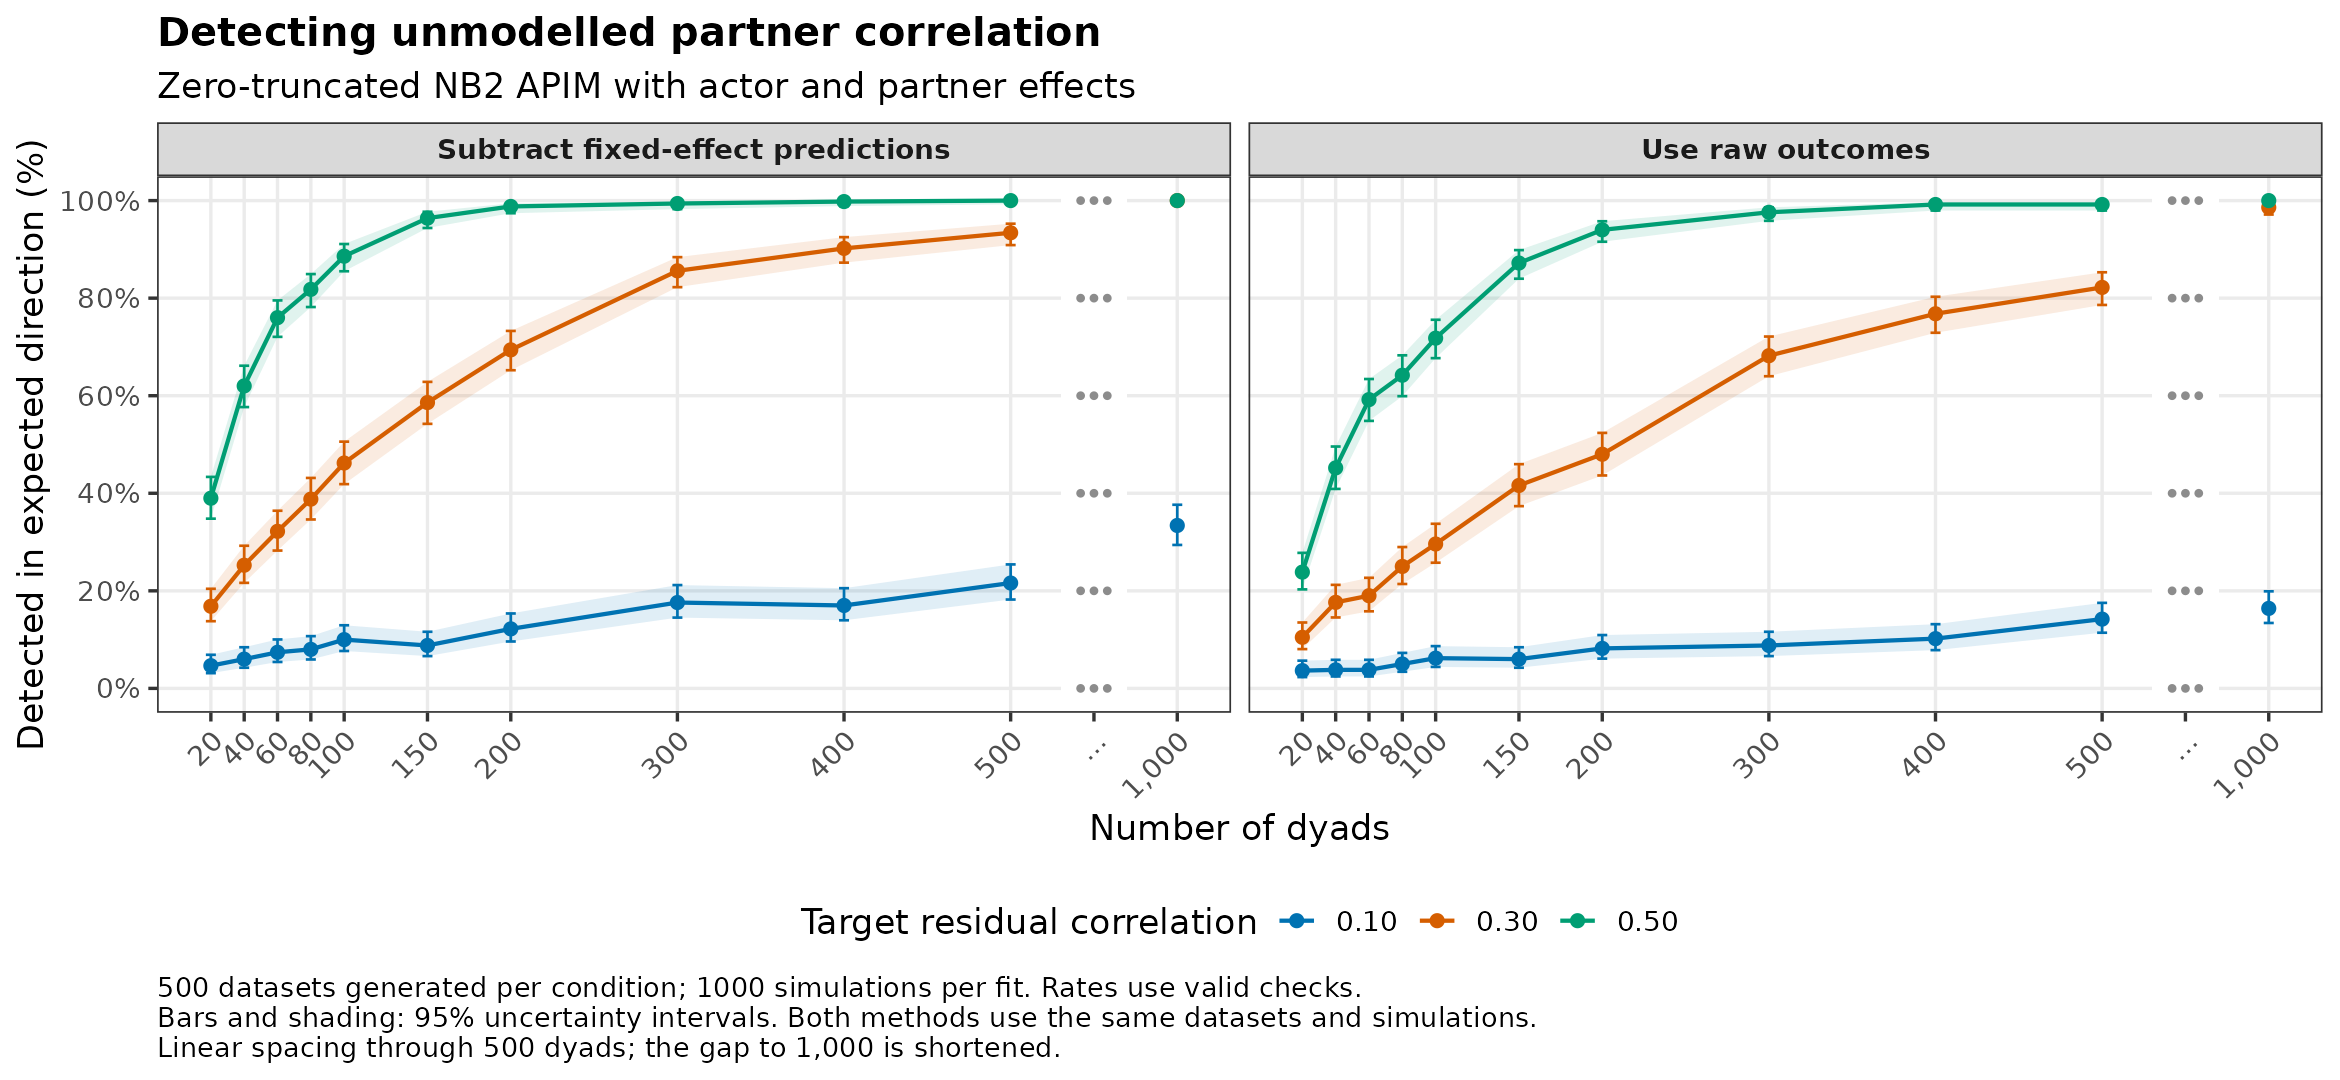
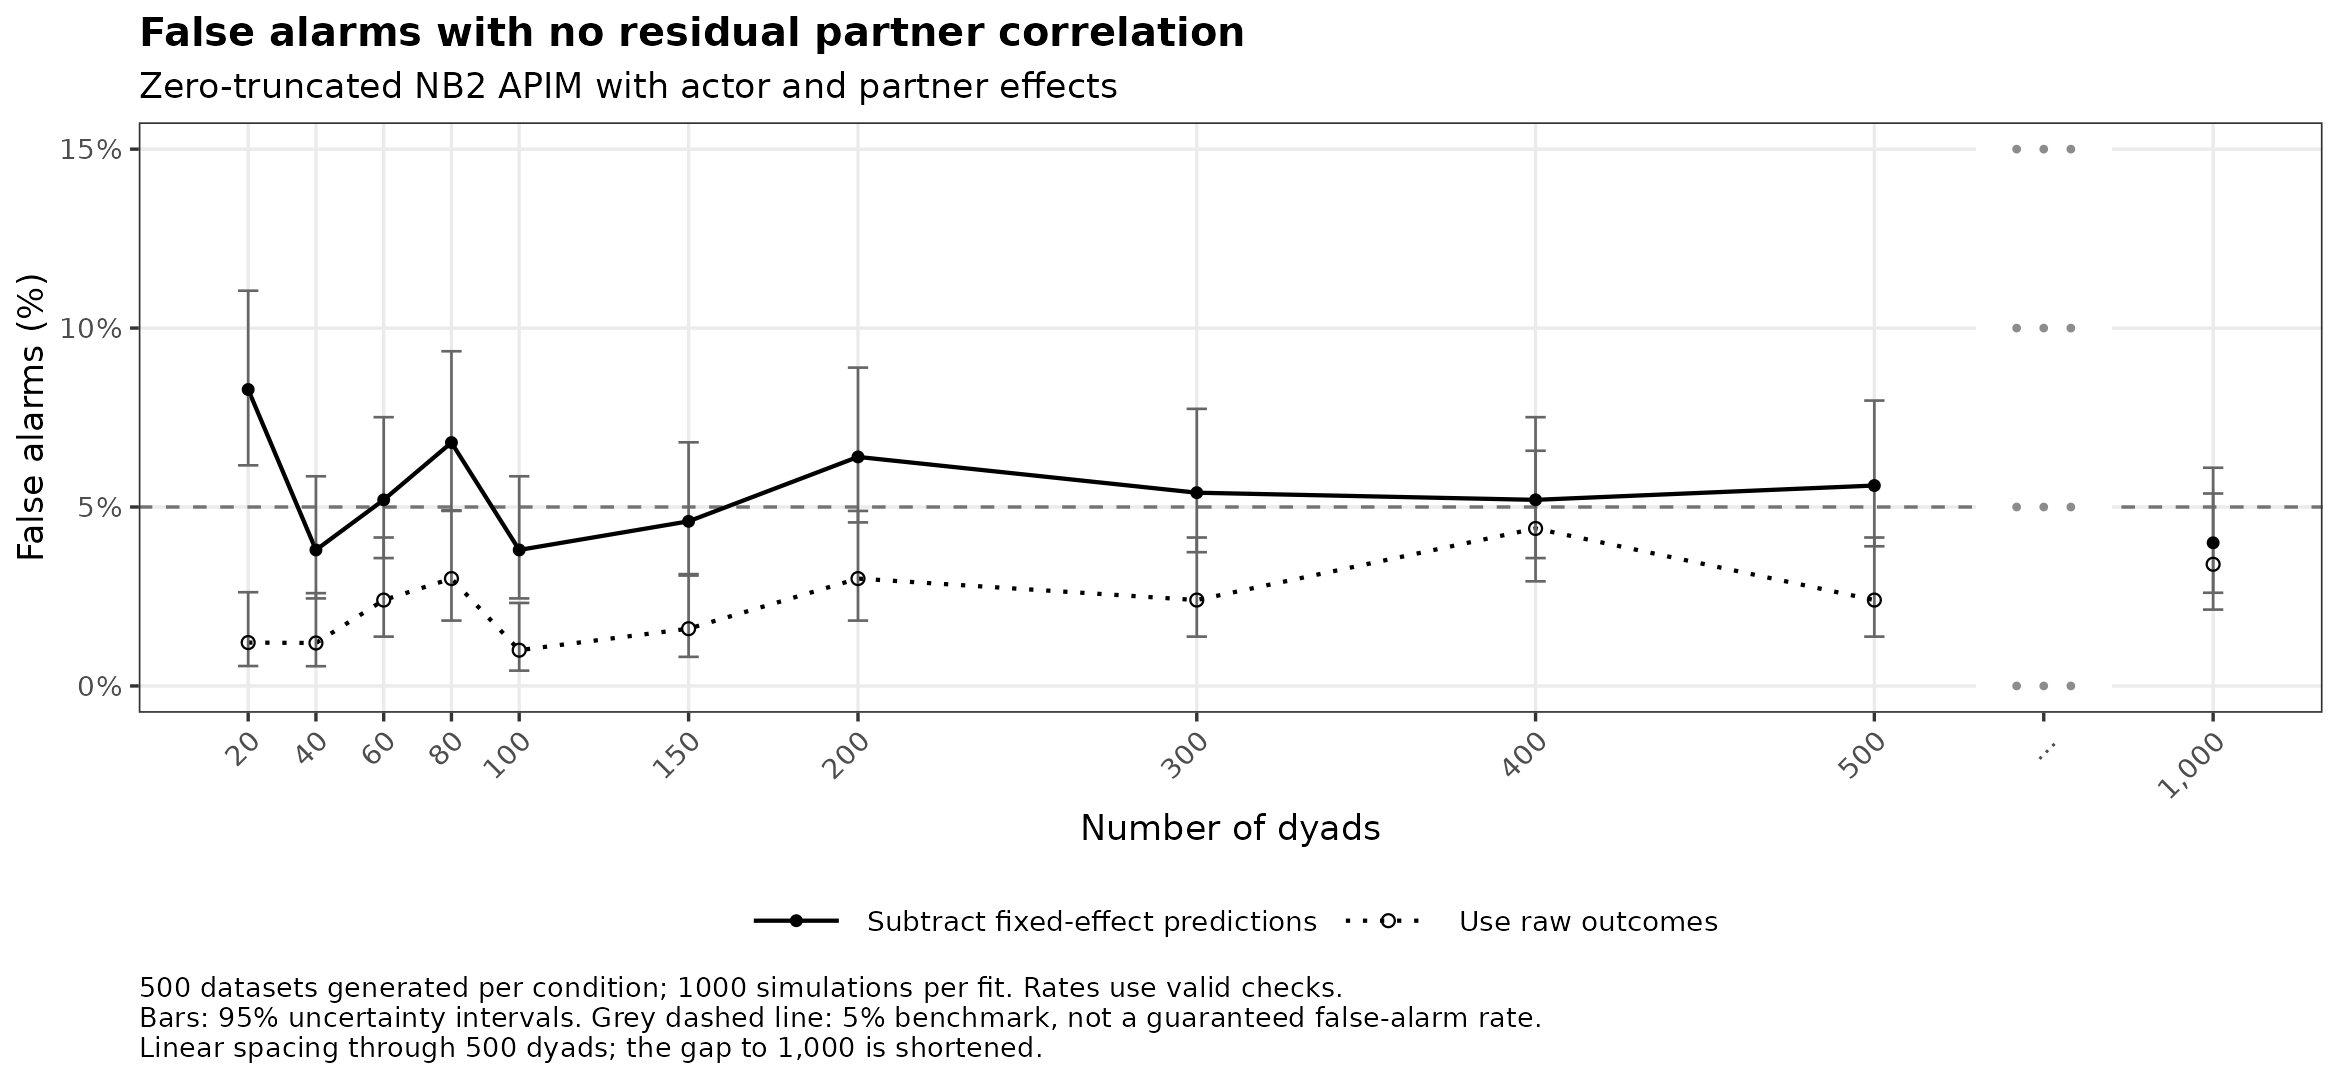
Model settings and checks
Fitted model:
outcome ~ actor_predictor + partner_predictor.
Mean: Actor effect 0.5, partner effect 0.3, log link, intercept 1.1.
Dispersion: size = 3, truncated at zero
Population correlations
Gaussian copula calibrated with 200000 pairs and independently verified with 500000 pairs.
| Target residual correlation | Verified correlation | Monte Carlo SE |
|---|---|---|
| 0.0 | 0.000 | 0.003 |
| 0.1 | 0.096 | 0.003 |
| 0.3 | 0.296 | 0.003 |
| 0.5 | 0.496 | 0.003 |
Opposite-direction flags with positive residual correlation
| Method | Datasets checked | Opposite-direction flags |
|---|---|---|
| model-centred | 16475 | 33 |
| raw | 16475 | 12 |
21970 of 22000 datasets produced reference simulations.
| Exclusion reason | Datasets |
|---|---|
| Convergence or Hessian problem | 30 |
Conditions with fewer usable checks
| Dyads | Residual correlation | Methods | Generated | Checked |
|---|---|---|---|---|
| 20 | 0.0 | model-centred, raw | 500 | 495 |
| 20 | 0.1 | model-centred, raw | 500 | 494 |
| 20 | 0.3 | model-centred, raw | 500 | 487 |
| 20 | 0.5 | model-centred, raw | 500 | 495 |
| 40 | 0.3 | model-centred, raw | 500 | 499 |
Counts for every plotted point are saved in the summary table.
Zero-truncated COM-Poisson
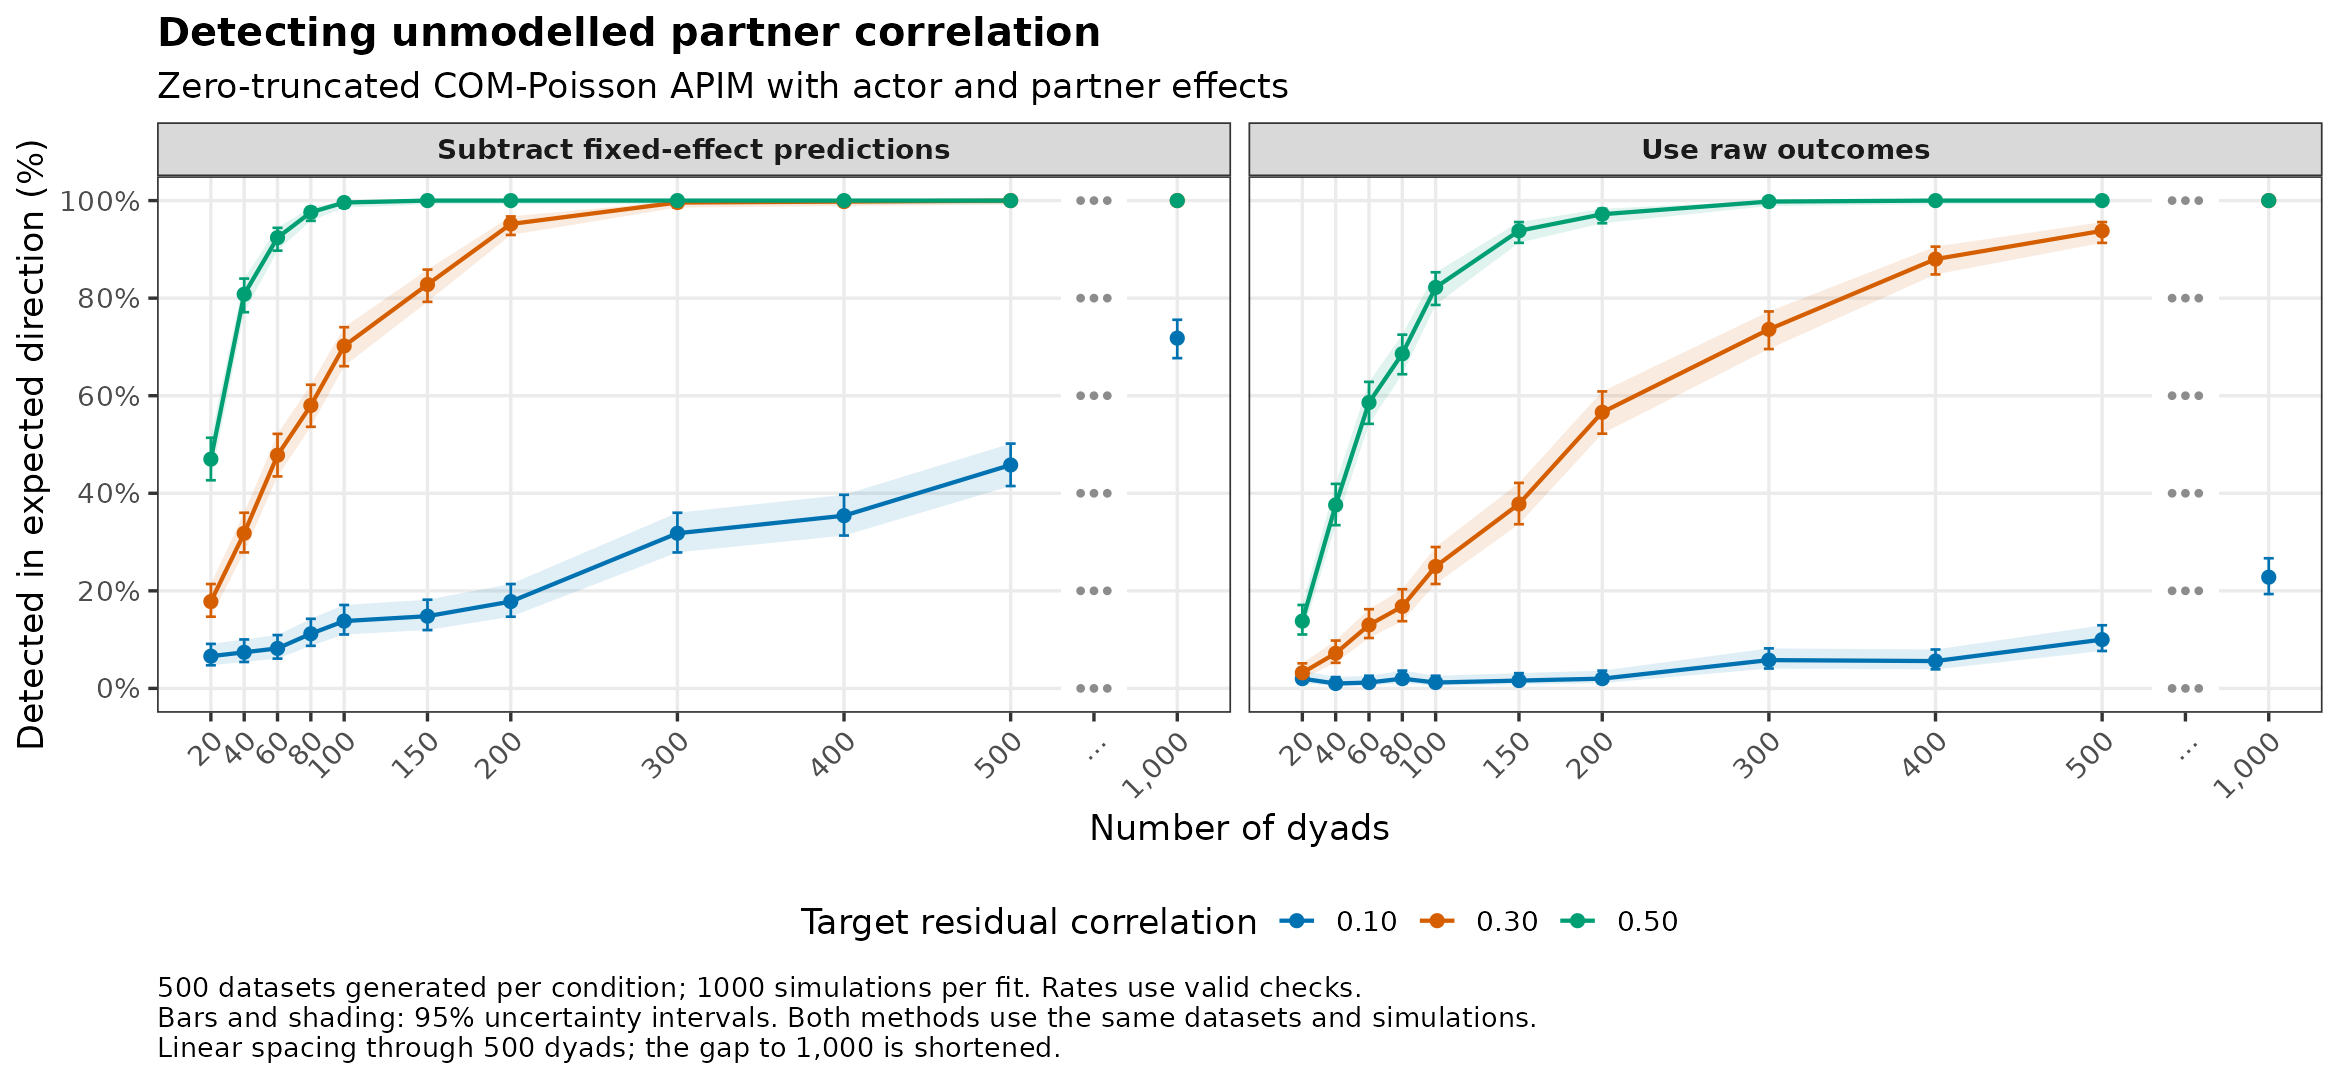
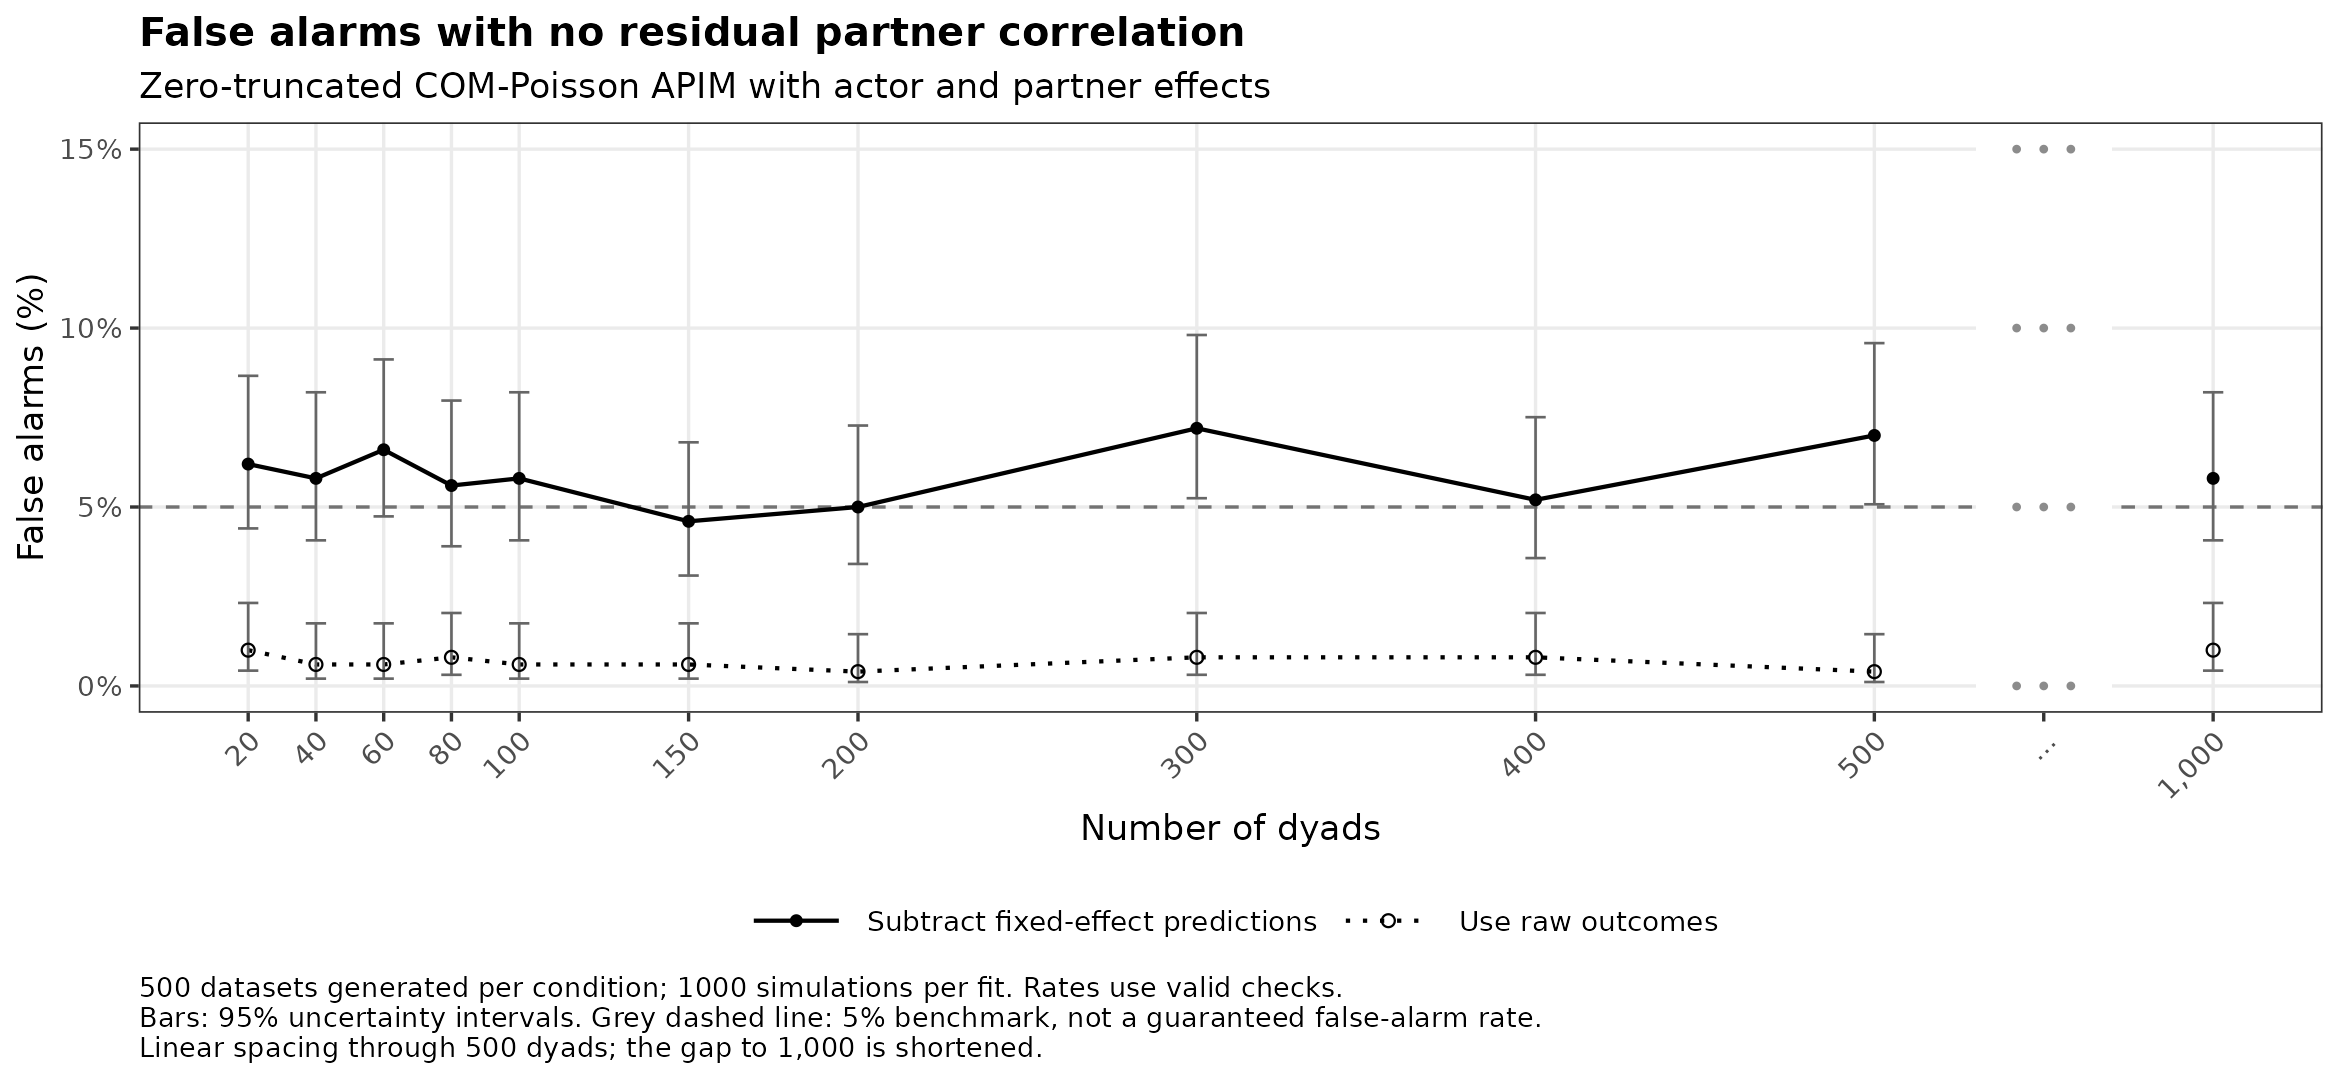
Model settings and checks
Fitted model:
outcome ~ actor_predictor + partner_predictor.
Mean: Actor effect 0.5, partner effect 0.3, log link, intercept 1.1.
Dispersion: phi = 0.5 (nu = 2), truncated at zero
Population correlations
Gaussian copula calibrated with 1000000 pairs and independently verified with 2000000 pairs.
| Target residual correlation | Verified correlation | Monte Carlo SE |
|---|---|---|
| 0.0 | 0.000 | 0.001 |
| 0.1 | 0.100 | 0.001 |
| 0.3 | 0.300 | 0.001 |
| 0.5 | 0.501 | 0.001 |
Opposite-direction flags with positive residual correlation
| Method | Datasets checked | Opposite-direction flags |
|---|---|---|
| model-centred | 16500 | 24 |
| raw | 16500 | 1 |
22000 of 22000 datasets produced reference simulations.
Counts for every plotted point are saved in the summary table.
Zero-truncated generalized Poisson
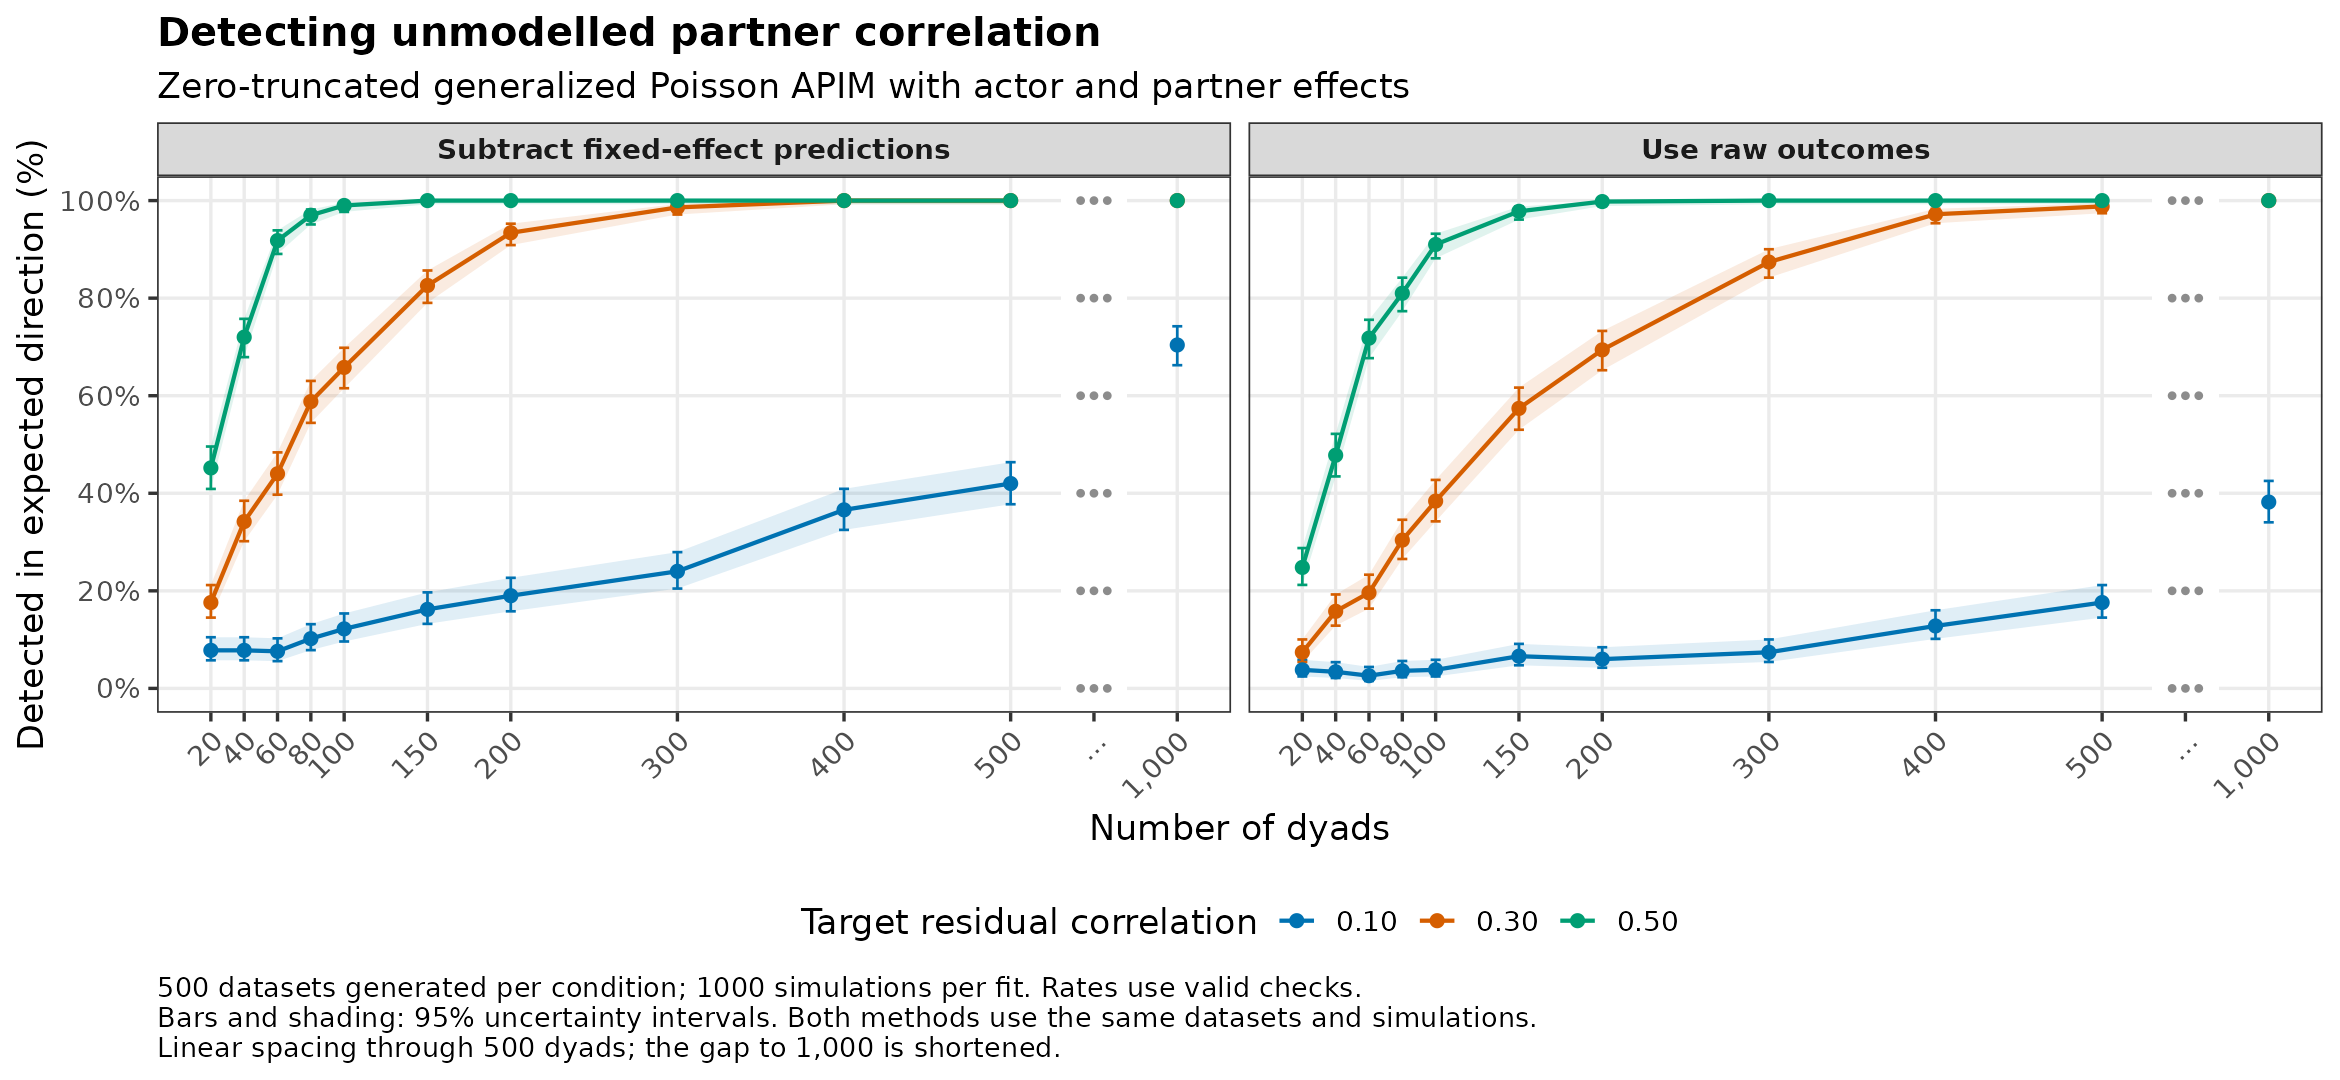
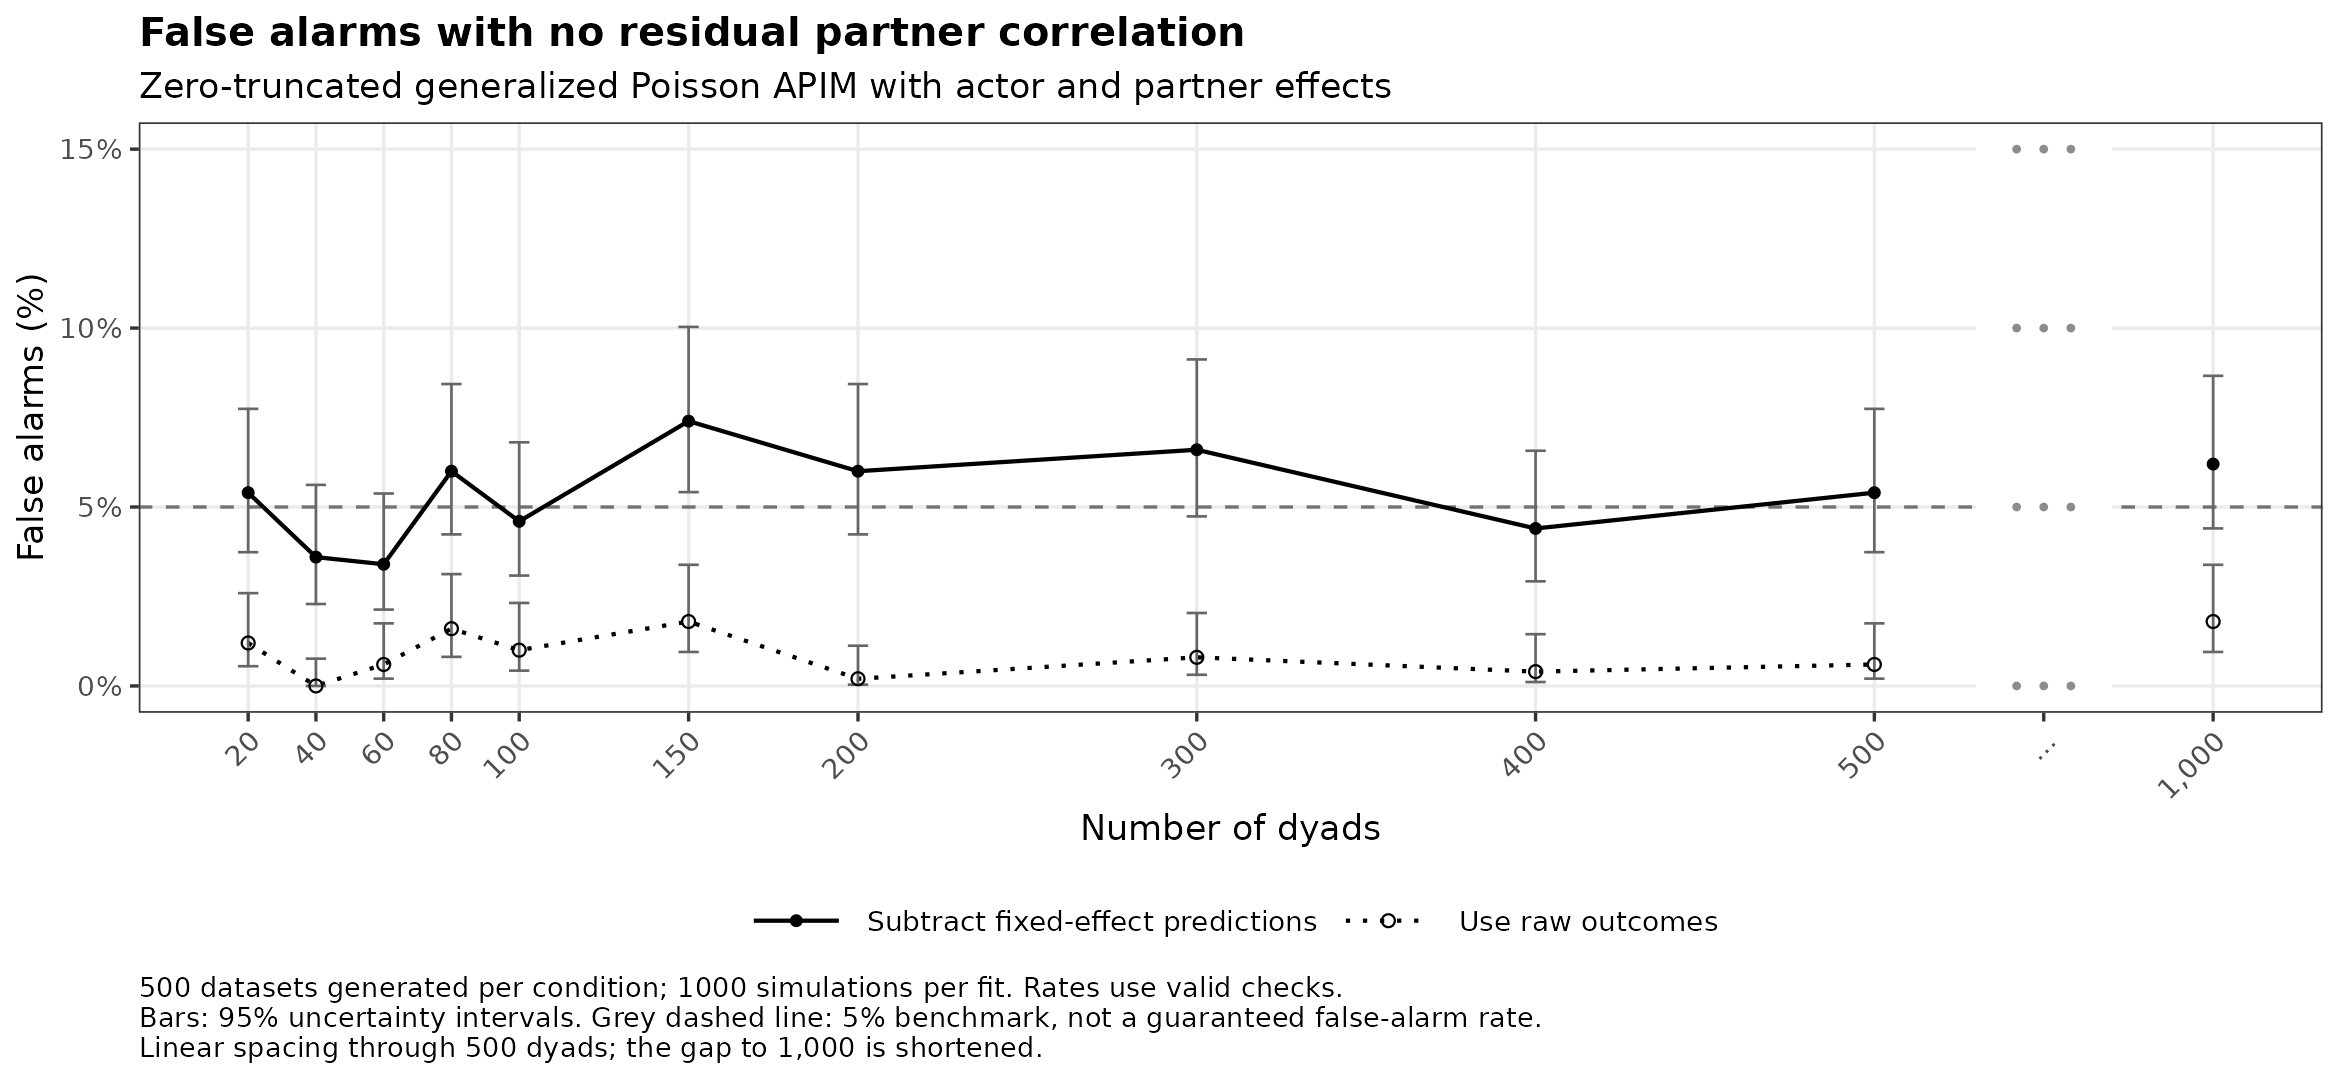
Model settings and checks
Fitted model:
outcome ~ actor_predictor + partner_predictor.
Mean: Actor effect 0.5, partner effect 0.3, log link, intercept 1.1.
Dispersion: phi = 2, truncated at zero
Population correlations
Gaussian copula calibrated with 1000000 pairs and independently verified with 2000000 pairs.
| Target residual correlation | Verified correlation | Monte Carlo SE |
|---|---|---|
| 0.0 | 0.001 | 0.001 |
| 0.1 | 0.100 | 0.001 |
| 0.3 | 0.300 | 0.001 |
| 0.5 | 0.500 | 0.001 |
Opposite-direction flags with positive residual correlation
| Method | Datasets checked | Opposite-direction flags |
|---|---|---|
| model-centred | 16500 | 21 |
| raw | 16500 | 1 |
22000 of 22000 datasets produced reference simulations.
Counts for every plotted point are saved in the summary table.
Tweedie
Model settings and checks
Fitted model:
outcome ~ actor_predictor + partner_predictor.
Mean: Actor effect 0.5, partner effect 0.3, log link, intercept 1.1.
Dispersion: phi = 1, power = 1.5
Population correlations
Gaussian copula calibrated with 1000000 pairs and independently verified with 2000000 pairs.
| Target residual correlation | Verified correlation | Monte Carlo SE |
|---|---|---|
| 0.0 | -0.001 | 0.001 |
| 0.1 | 0.098 | 0.001 |
| 0.3 | 0.297 | 0.001 |
| 0.5 | 0.497 | 0.001 |
Opposite-direction flags with positive residual correlation
| Method | Datasets checked | Opposite-direction flags |
|---|---|---|
| model-centred | 16473 | 21 |
| raw | 16473 | 5 |
21968 of 22000 datasets produced reference simulations.
| Exclusion reason | Datasets |
|---|---|
| Convergence or Hessian problem | 32 |
Conditions with fewer usable checks
| Dyads | Residual correlation | Methods | Generated | Checked |
|---|---|---|---|---|
| 20 | 0.0 | model-centred, raw | 500 | 496 |
| 20 | 0.1 | model-centred, raw | 500 | 494 |
| 20 | 0.3 | model-centred, raw | 500 | 497 |
| 20 | 0.5 | model-centred, raw | 500 | 486 |
| 40 | 0.0 | model-centred, raw | 500 | 499 |
| 40 | 0.1 | model-centred, raw | 500 | 499 |
| 40 | 0.3 | model-centred, raw | 500 | 498 |
| 60 | 0.3 | model-centred, raw | 500 | 499 |
Counts for every plotted point are saved in the summary table.
Gamma
Model settings and checks
Fitted model:
outcome ~ actor_predictor + partner_predictor.
Mean: Actor effect 0.5, partner effect 0.3, log link, intercept 1.1.
Dispersion: shape = 3
Population correlations
Gaussian copula calibrated with 200000 pairs and independently verified with 500000 pairs.
| Target residual correlation | Verified correlation | Monte Carlo SE |
|---|---|---|
| 0.0 | 0.002 | 0.003 |
| 0.1 | 0.098 | 0.003 |
| 0.3 | 0.299 | 0.003 |
| 0.5 | 0.500 | 0.003 |
Opposite-direction flags with positive residual correlation
| Method | Datasets checked | Opposite-direction flags |
|---|---|---|
| model-centred | 16500 | 34 |
| raw | 16500 | 30 |
22000 of 22000 datasets produced reference simulations.
Counts for every plotted point are saved in the summary table.
Beta
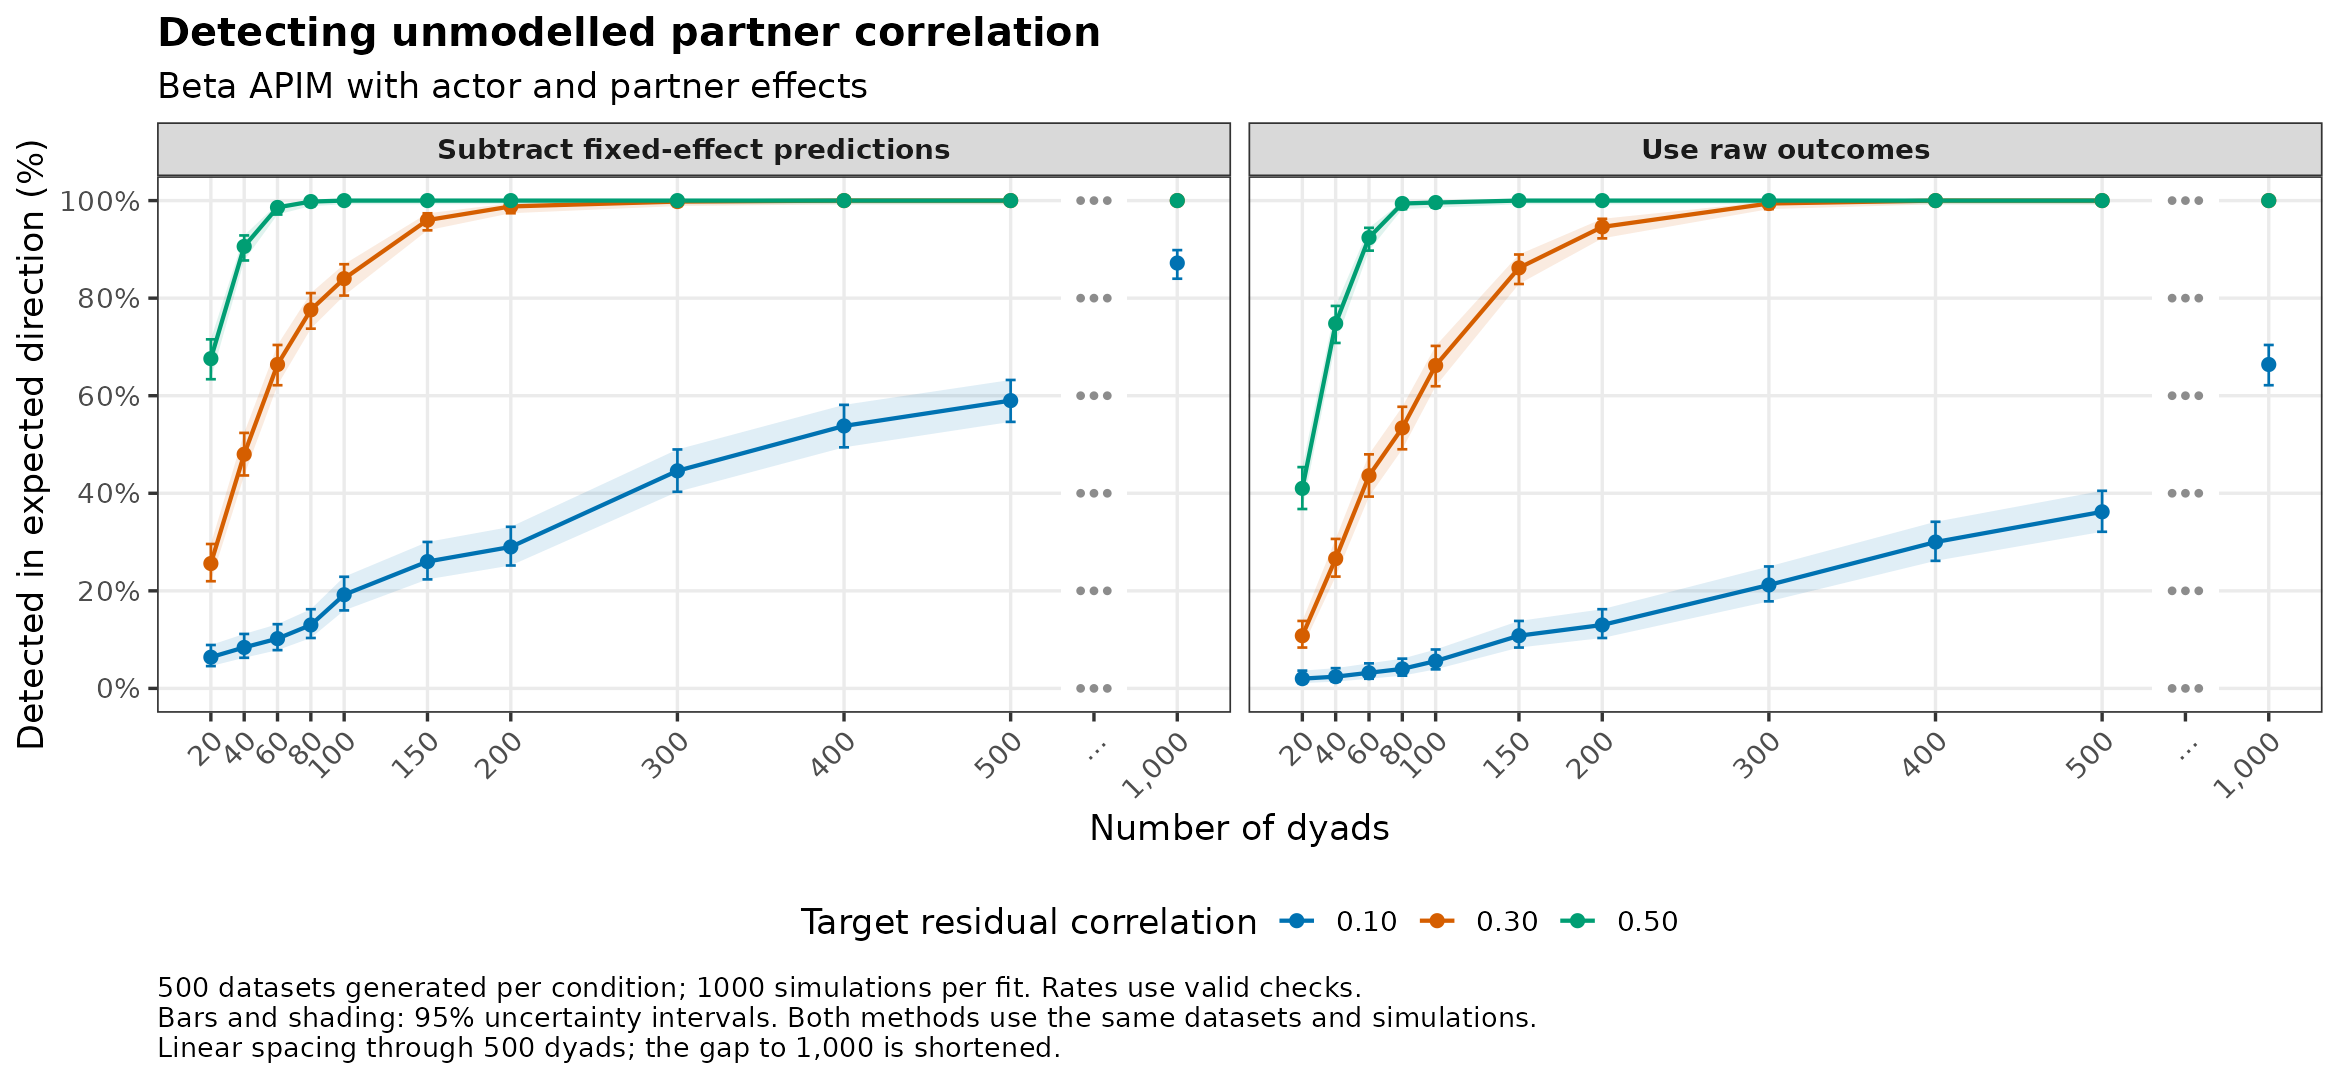
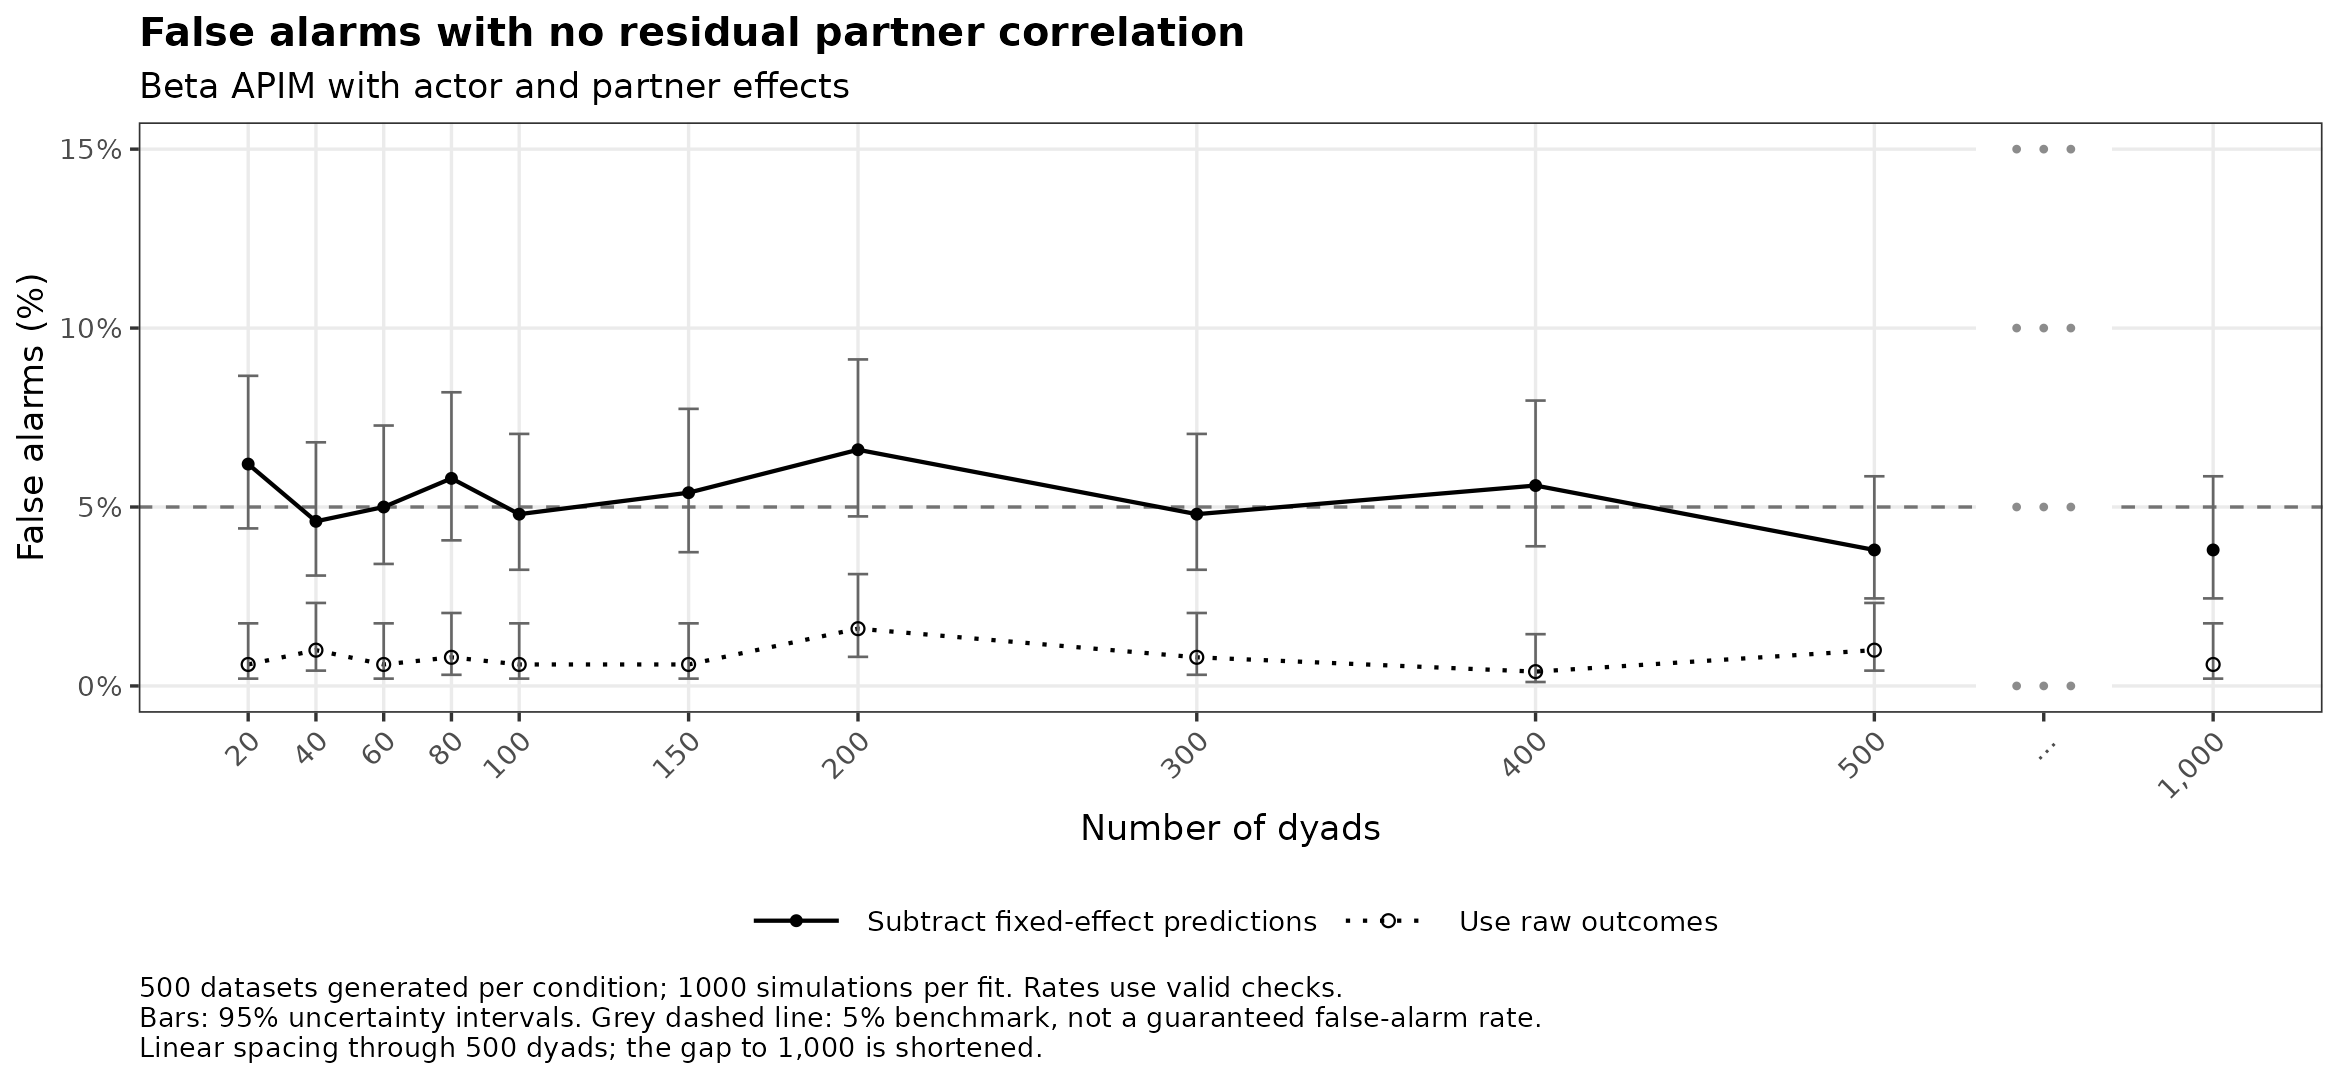
Model settings and checks
Fitted model:
outcome ~ actor_predictor + partner_predictor.
Mean: Actor effect 0.5, partner effect 0.3, logit link, intercept 0.
Dispersion: precision = 8
Population correlations
Gaussian copula calibrated with 200000 pairs and independently verified with 500000 pairs.
| Target residual correlation | Verified correlation | Monte Carlo SE |
|---|---|---|
| 0.0 | 0.0 | 0.001 |
| 0.1 | 0.1 | 0.001 |
| 0.3 | 0.3 | 0.001 |
| 0.5 | 0.5 | 0.001 |
Opposite-direction flags with positive residual correlation
| Method | Datasets checked | Opposite-direction flags |
|---|---|---|
| model-centred | 16500 | 14 |
| raw | 16500 | 0 |
22000 of 22000 datasets produced reference simulations.
Counts for every plotted point are saved in the summary table.
Lognormal
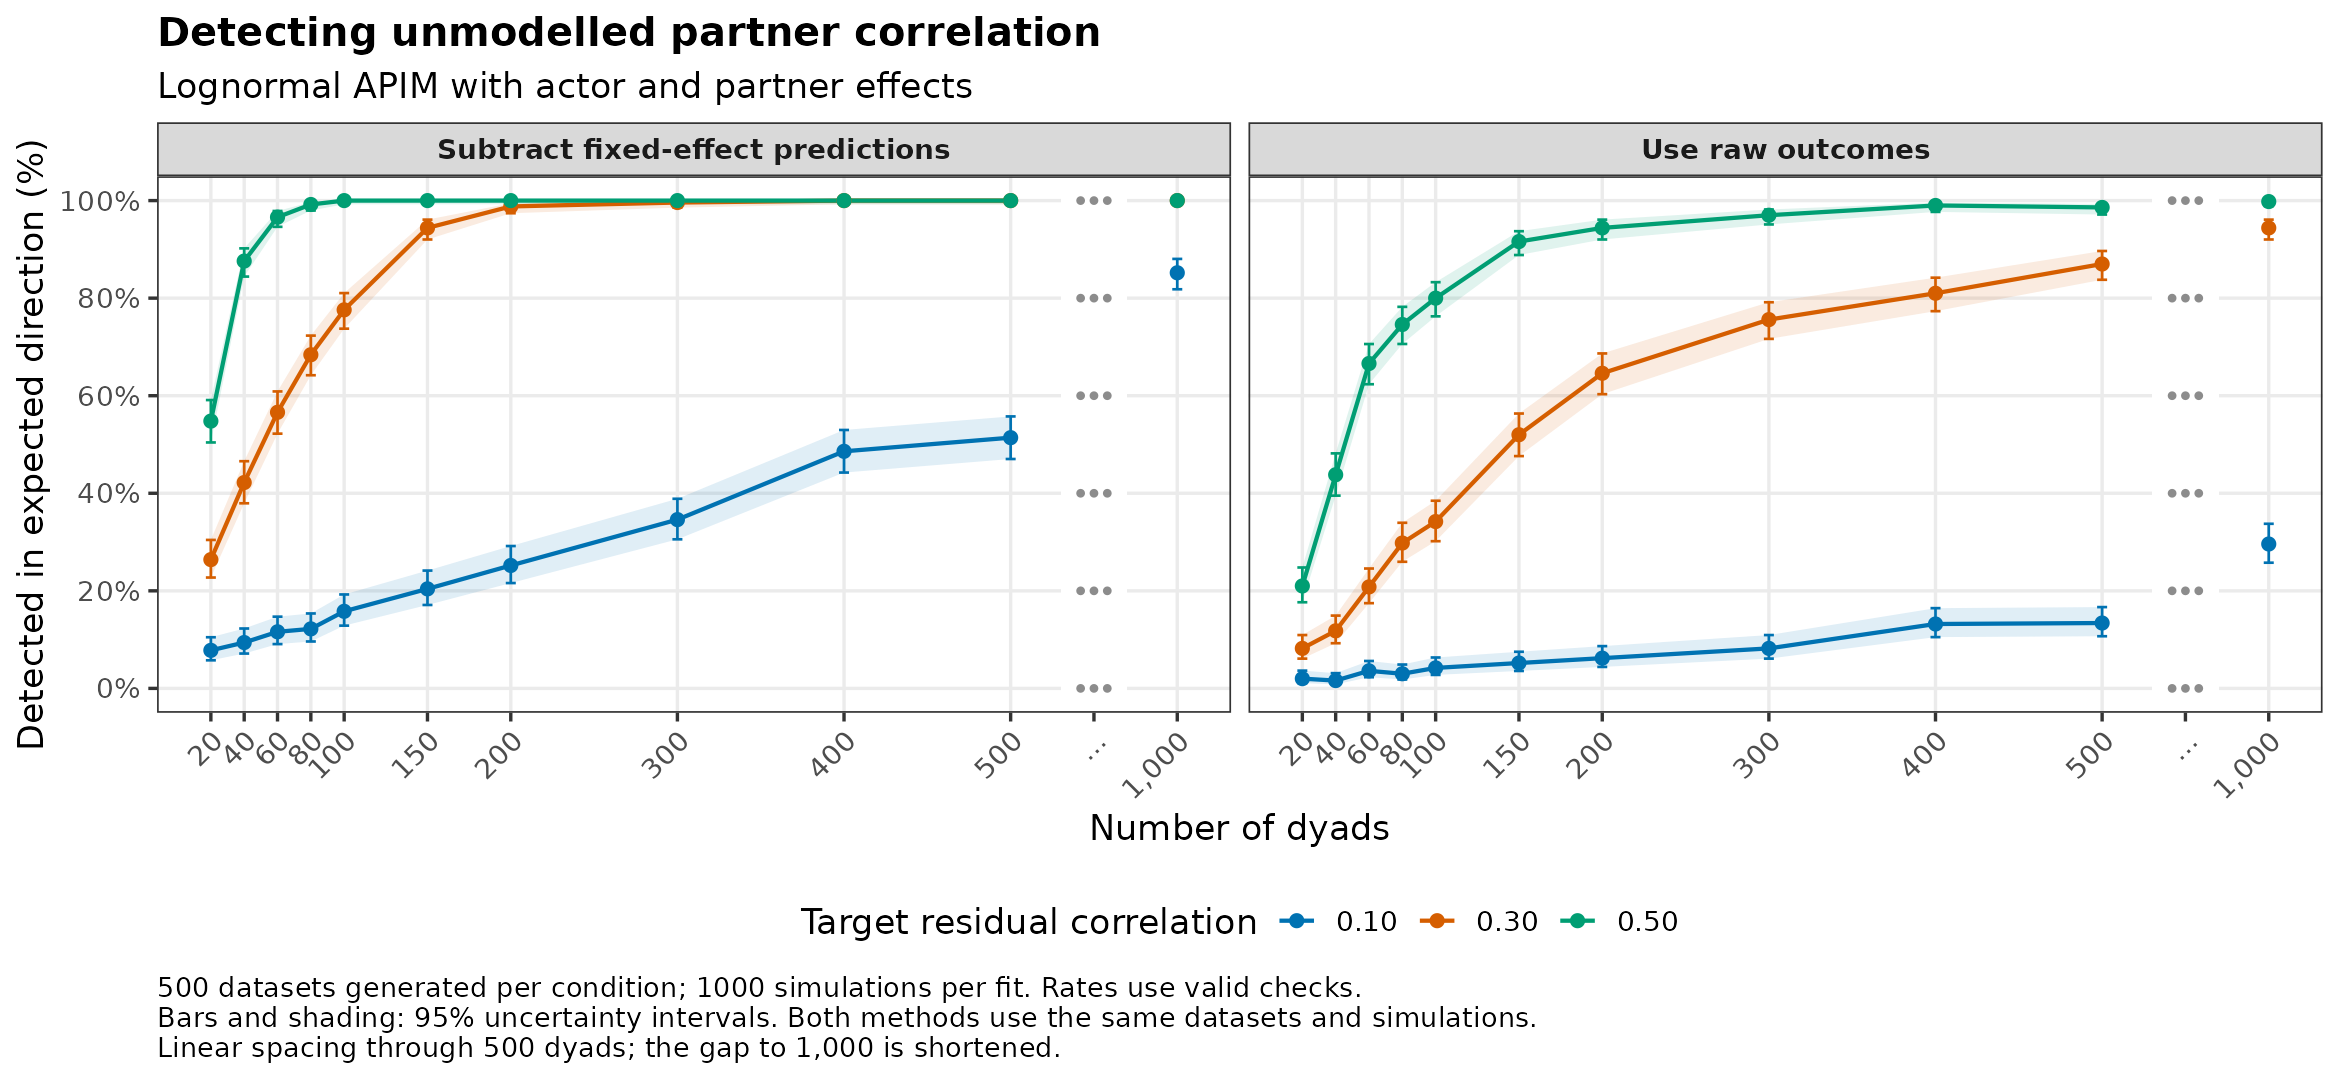
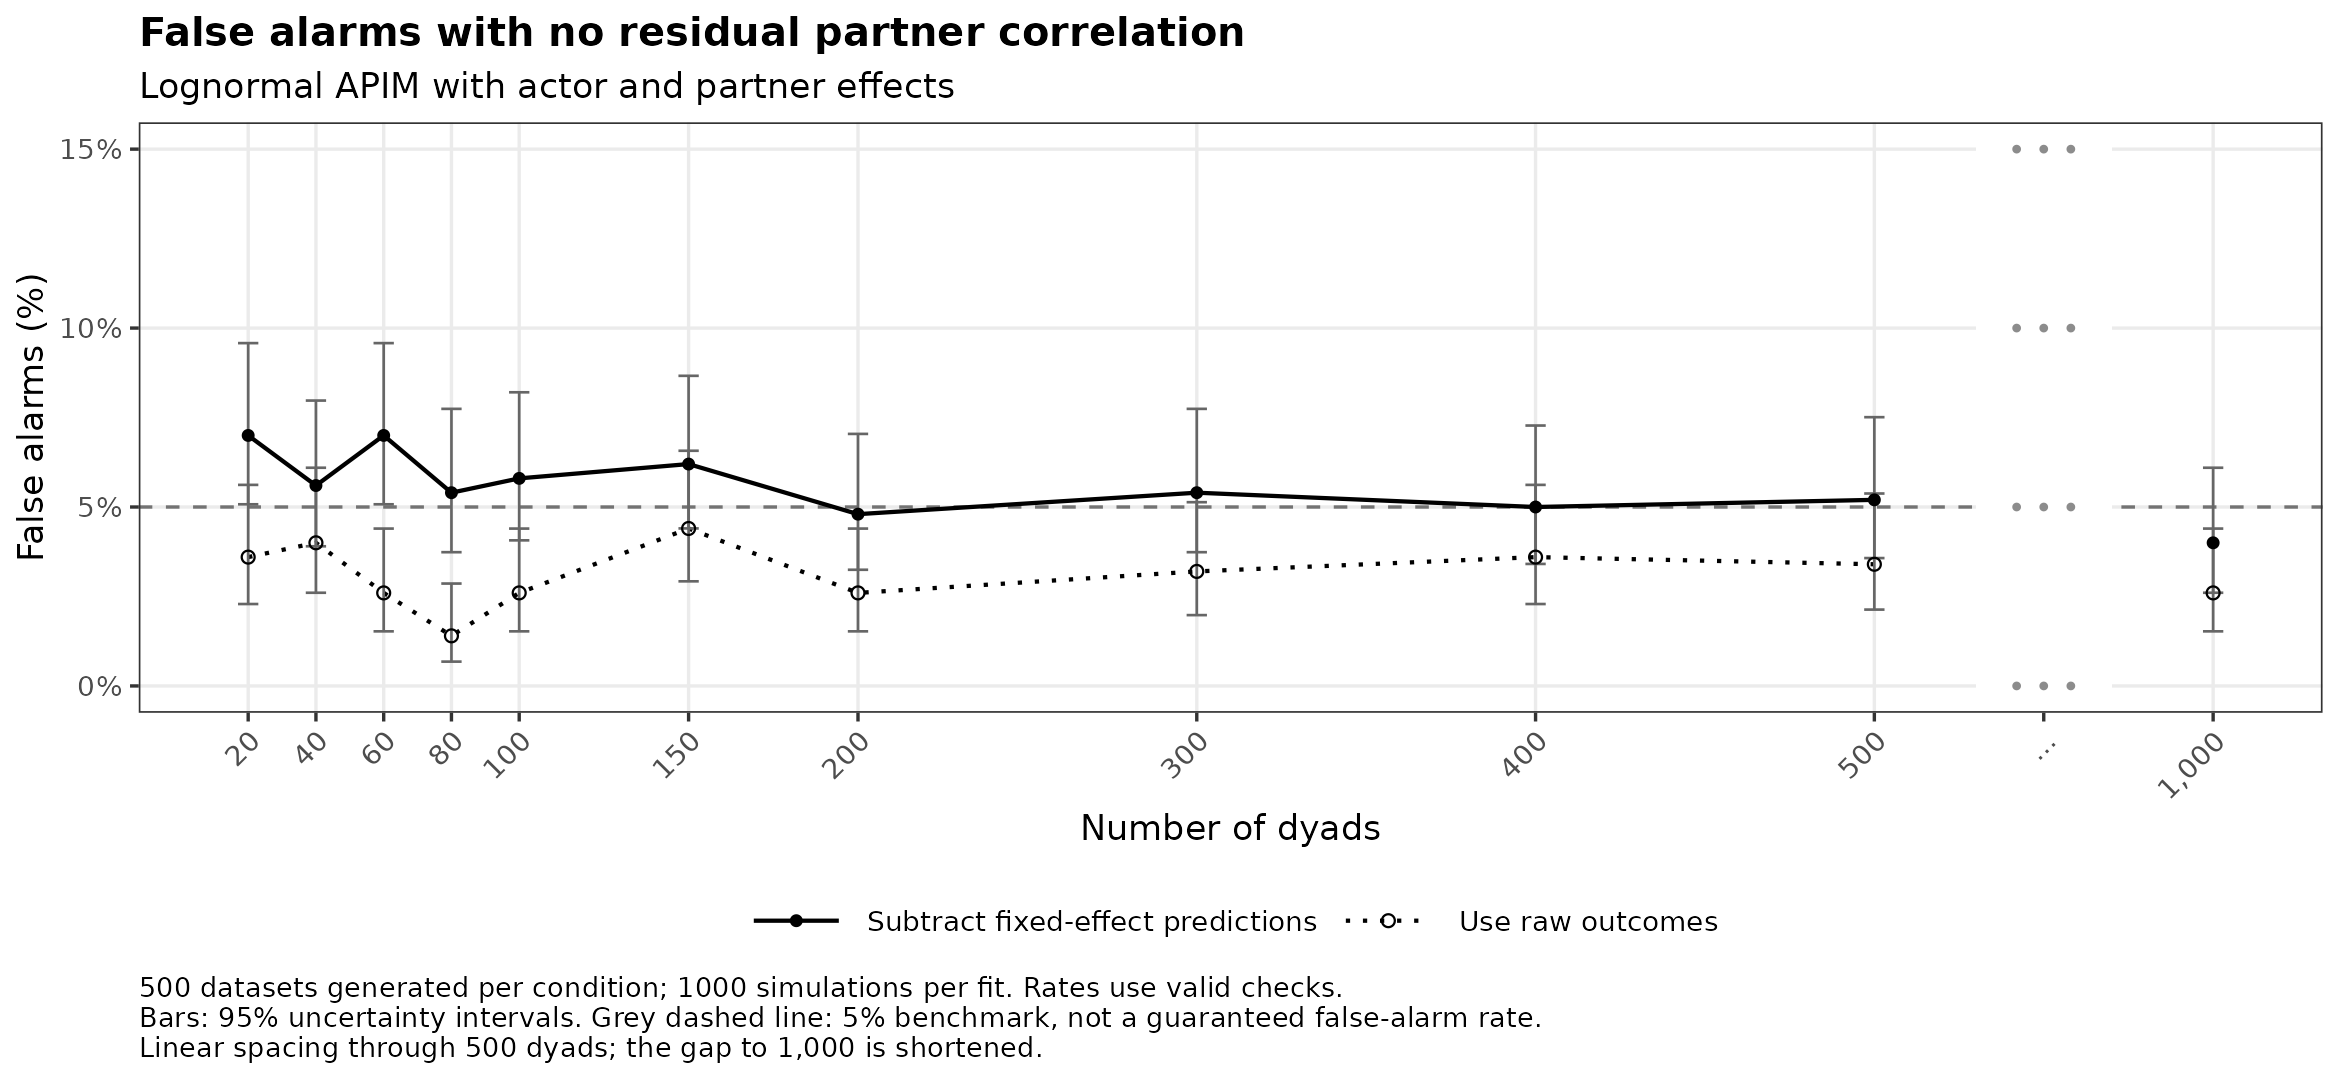
Model settings and checks
Fitted model:
outcome ~ actor_predictor + partner_predictor.
Mean: Actor effect 0.5, partner effect 0.3, log link, intercept 1.1.
Dispersion: response SD = 2
Population correlations
Analytic lognormal covariance and 40/80-node Gaussian quadrature.
| Target residual correlation | Verified correlation | Monte Carlo SE |
|---|---|---|
| 0.0 | 0.0 | 0 |
| 0.1 | 0.1 | 0 |
| 0.3 | 0.3 | 0 |
| 0.5 | 0.5 | 0 |
Opposite-direction flags with positive residual correlation
| Method | Datasets checked | Opposite-direction flags |
|---|---|---|
| model-centred | 16500 | 12 |
| raw | 16500 | 98 |
22000 of 22000 datasets produced reference simulations.
Counts for every plotted point are saved in the summary table.
Skew-normal
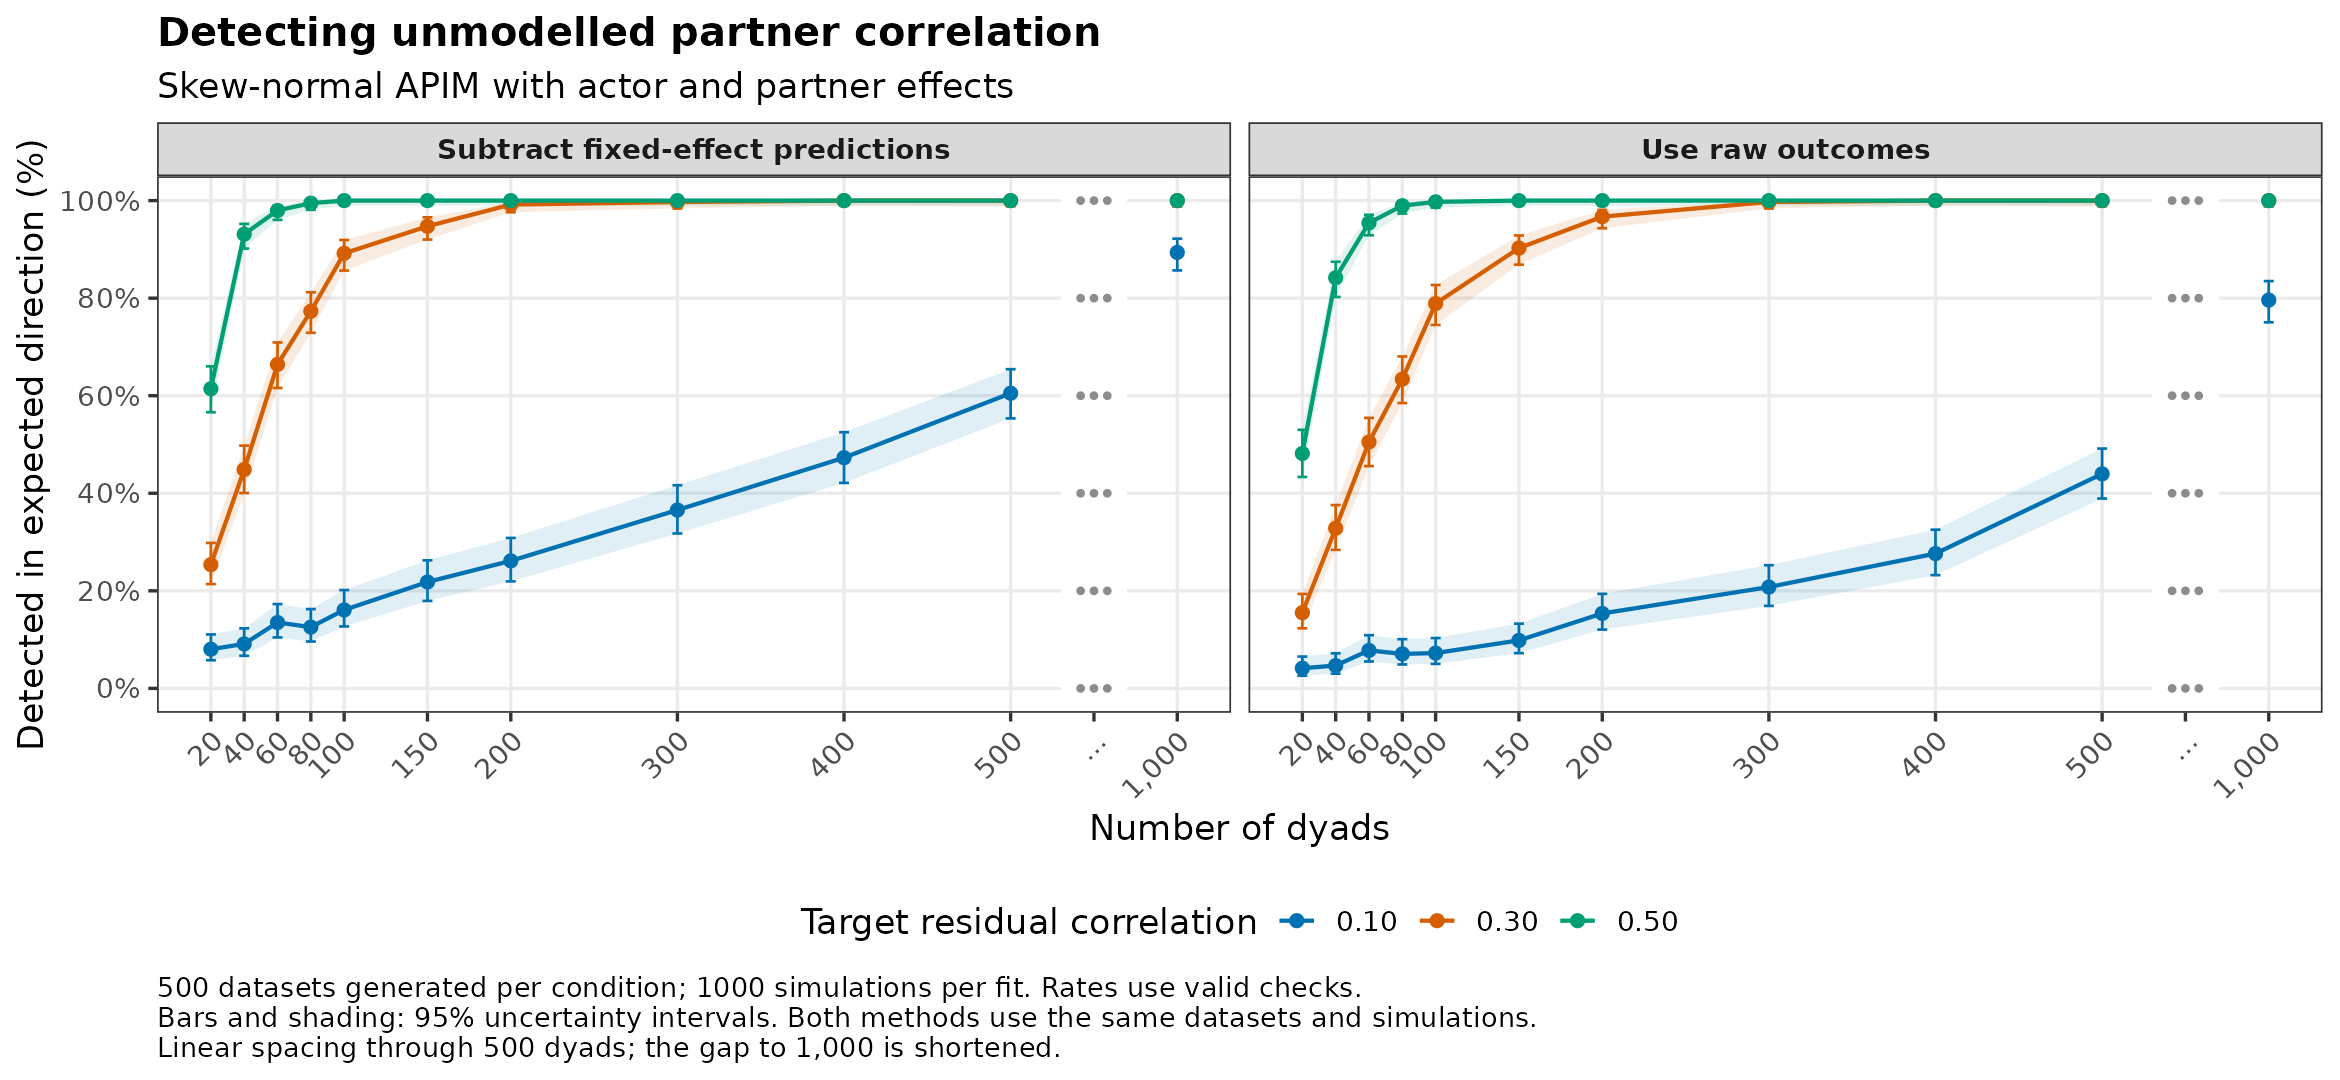
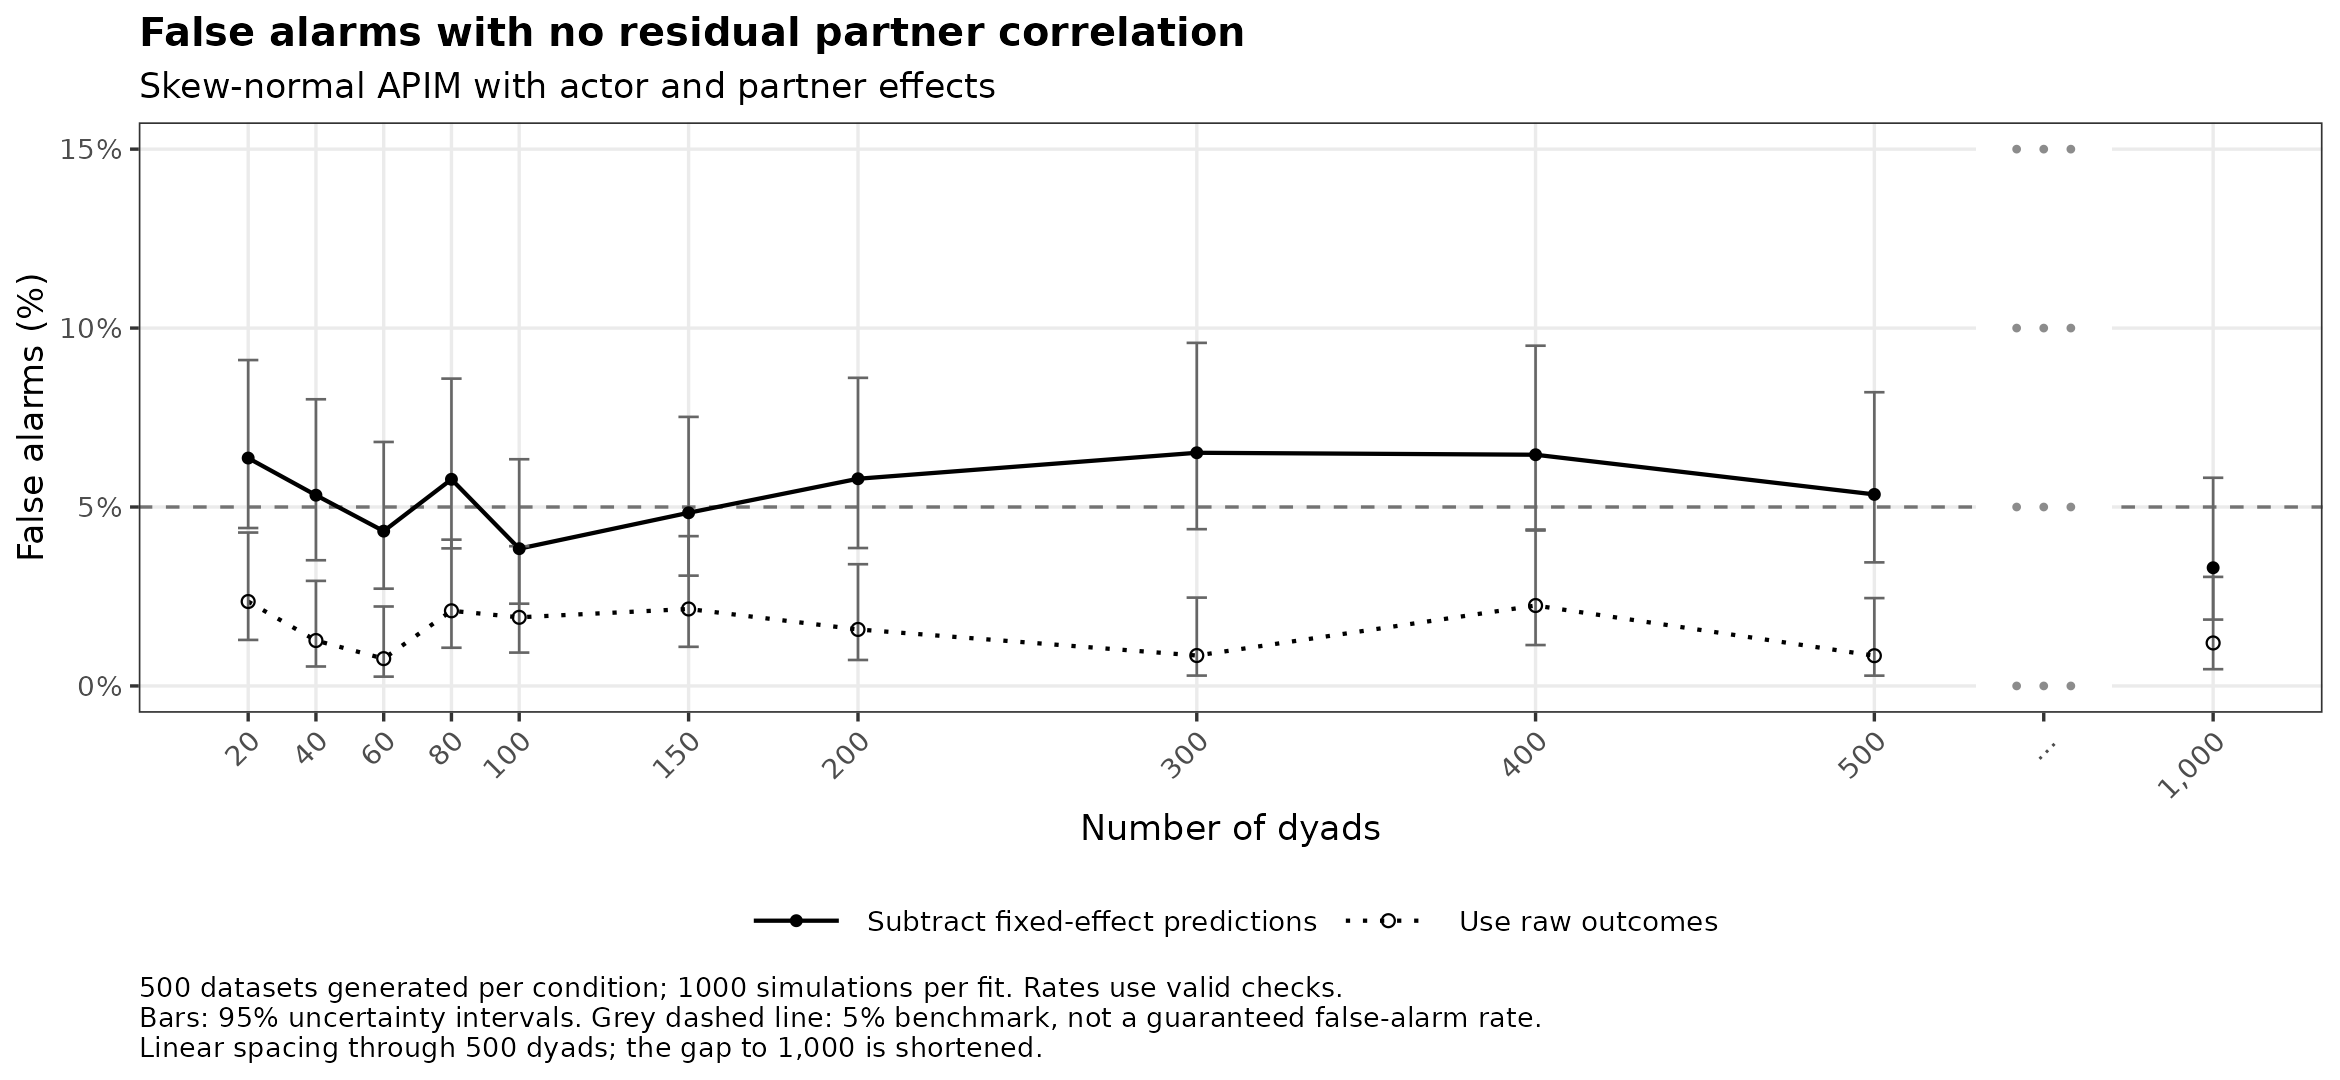
Model settings and checks
Fitted model:
outcome ~ actor_predictor + partner_predictor.
Mean: Actor effect 0.5, partner effect 0.3, identity link, intercept 0.
Dispersion: response SD = 1, shape = 1
Population correlations
Gaussian copula calibrated with 200000 pairs and independently verified with 500000 pairs.
| Target residual correlation | Verified correlation | Monte Carlo SE |
|---|---|---|
| 0.0 | 0.002 | 0.001 |
| 0.1 | 0.100 | 0.001 |
| 0.3 | 0.301 | 0.001 |
| 0.5 | 0.501 | 0.001 |
Opposite-direction flags with positive residual correlation
| Method | Datasets checked | Opposite-direction flags |
|---|---|---|
| model-centred | 12330 | 16 |
| raw | 12330 | 1 |
16436 of 22000 datasets produced reference simulations.
| Exclusion reason | Datasets |
|---|---|
| Convergence or Hessian problem | 5564 |
Conditions with fewer usable checks
| Dyads | Residual correlation | Methods | Generated | Checked |
|---|---|---|---|---|
| 20 | 0.0 | model-centred, raw | 500 | 424 |
| 20 | 0.1 | model-centred, raw | 500 | 411 |
| 20 | 0.3 | model-centred, raw | 500 | 406 |
| 20 | 0.5 | model-centred, raw | 500 | 407 |
| 40 | 0.0 | model-centred, raw | 500 | 394 |
| 40 | 0.1 | model-centred, raw | 500 | 406 |
| 40 | 0.3 | model-centred, raw | 500 | 399 |
| 40 | 0.5 | model-centred, raw | 500 | 392 |
| 60 | 0.0 | model-centred, raw | 500 | 393 |
| 60 | 0.1 | model-centred, raw | 500 | 385 |
| 60 | 0.3 | model-centred, raw | 500 | 390 |
| 60 | 0.5 | model-centred, raw | 500 | 394 |
| 80 | 0.0 | model-centred, raw | 500 | 381 |
| 80 | 0.1 | model-centred, raw | 500 | 382 |
| 80 | 0.3 | model-centred, raw | 500 | 388 |
| 80 | 0.5 | model-centred, raw | 500 | 381 |
| 100 | 0.0 | model-centred, raw | 500 | 365 |
| 100 | 0.1 | model-centred, raw | 500 | 373 |
| 100 | 0.3 | model-centred, raw | 500 | 379 |
| 100 | 0.5 | model-centred, raw | 500 | 387 |
| 150 | 0.0 | model-centred, raw | 500 | 372 |
| 150 | 0.1 | model-centred, raw | 500 | 376 |
| 150 | 0.3 | model-centred, raw | 500 | 380 |
| 150 | 0.5 | model-centred, raw | 500 | 391 |
| 200 | 0.0 | model-centred, raw | 500 | 380 |
| 200 | 0.1 | model-centred, raw | 500 | 371 |
| 200 | 0.3 | model-centred, raw | 500 | 364 |
| 200 | 0.5 | model-centred, raw | 500 | 353 |
| 300 | 0.0 | model-centred, raw | 500 | 353 |
| 300 | 0.1 | model-centred, raw | 500 | 361 |
| 300 | 0.3 | model-centred, raw | 500 | 346 |
| 300 | 0.5 | model-centred, raw | 500 | 363 |
| 400 | 0.0 | model-centred, raw | 500 | 356 |
| 400 | 0.1 | model-centred, raw | 500 | 351 |
| 400 | 0.3 | model-centred, raw | 500 | 366 |
| 400 | 0.5 | model-centred, raw | 500 | 363 |
| 500 | 0.0 | model-centred, raw | 500 | 355 |
| 500 | 0.1 | model-centred, raw | 500 | 357 |
| 500 | 0.3 | model-centred, raw | 500 | 326 |
| 500 | 0.5 | model-centred, raw | 500 | 372 |
| 1000 | 0.0 | model-centred, raw | 500 | 333 |
| 1000 | 0.1 | model-centred, raw | 500 | 348 |
| 1000 | 0.3 | model-centred, raw | 500 | 326 |
| 1000 | 0.5 | model-centred, raw | 500 | 336 |
Counts for every plotted point are saved in the summary table.
Bell
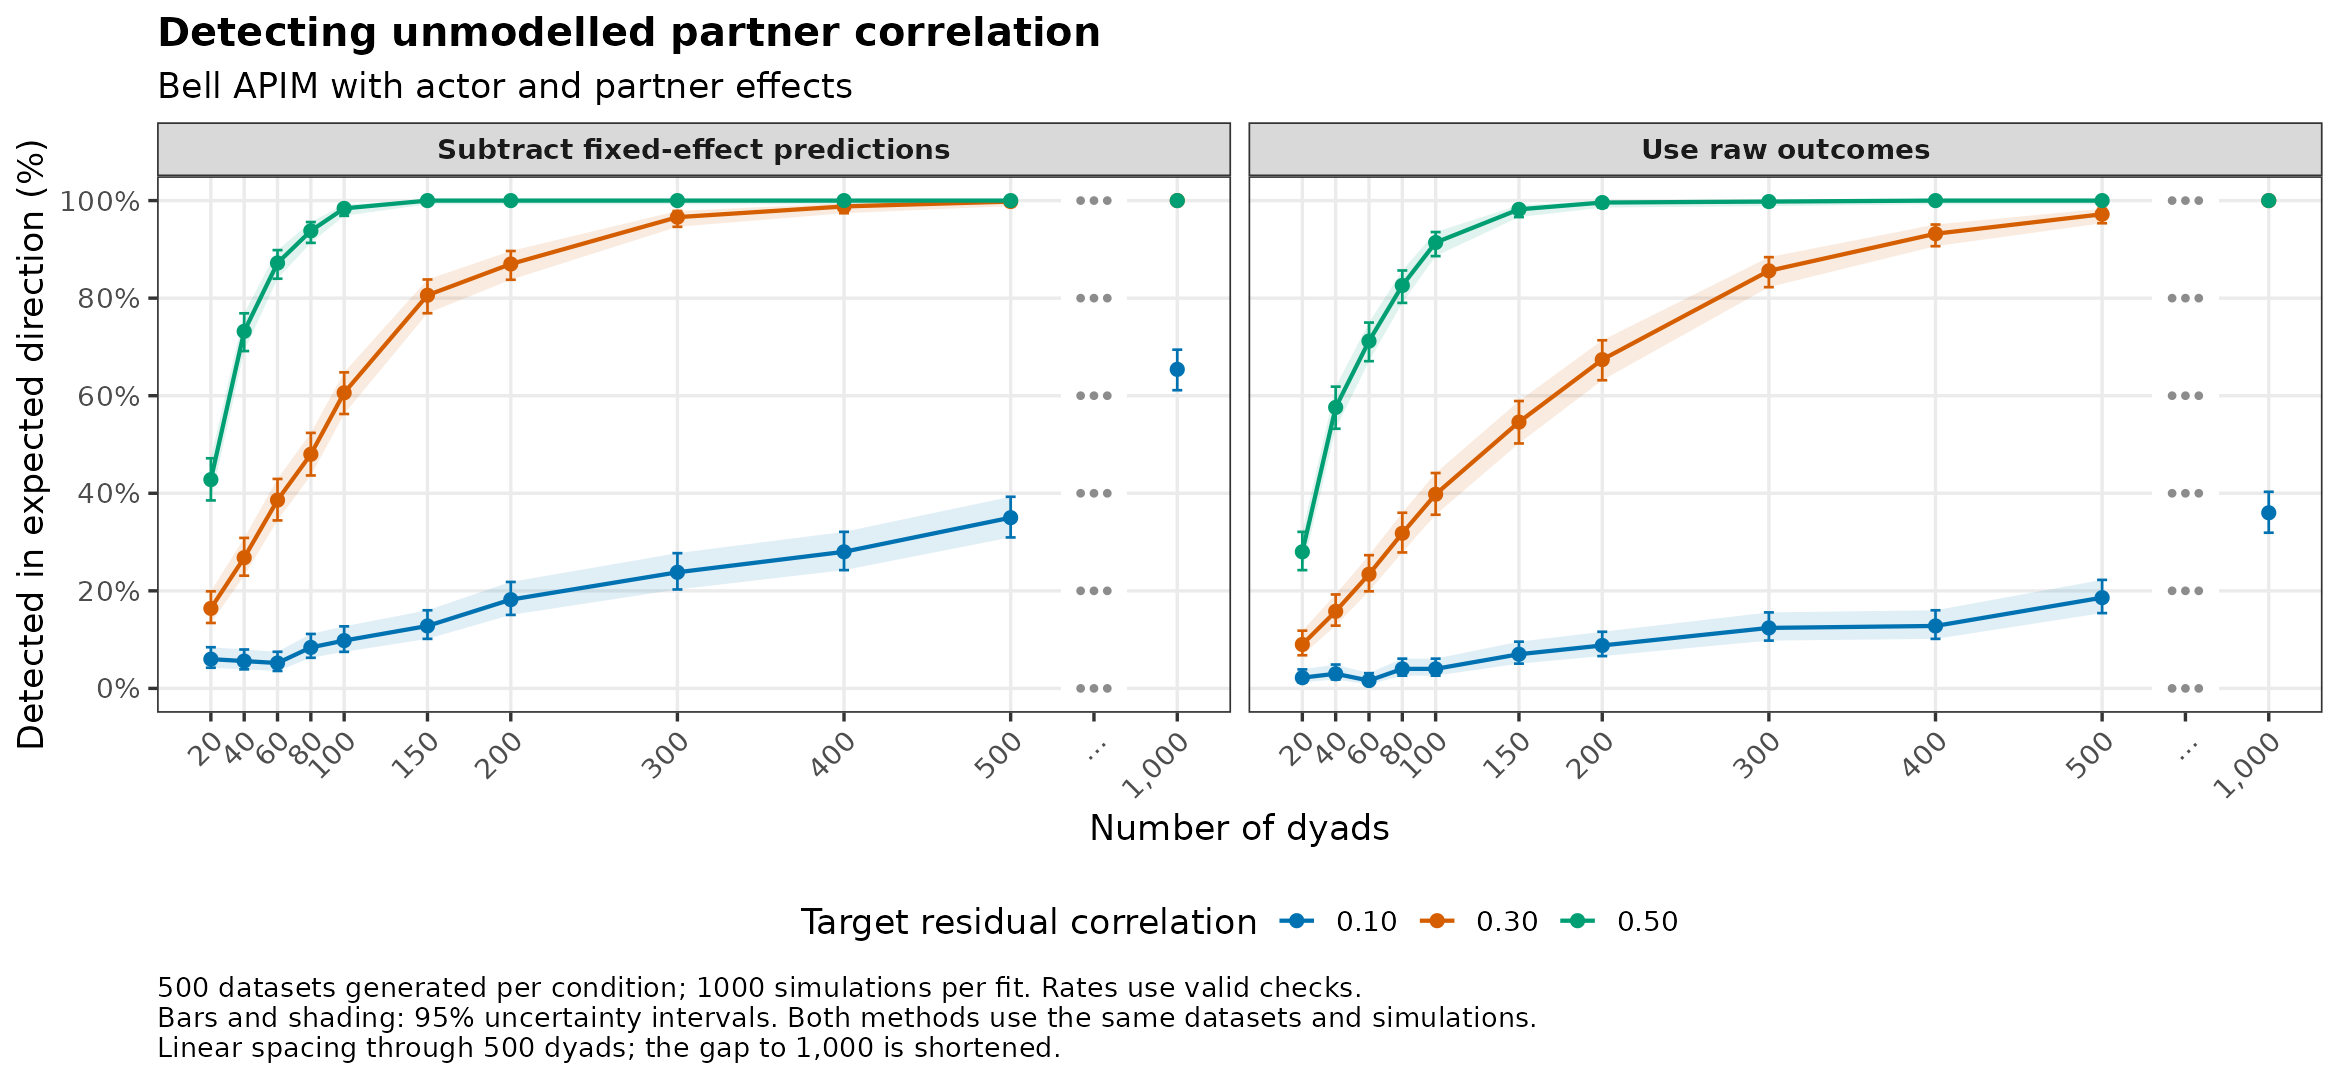
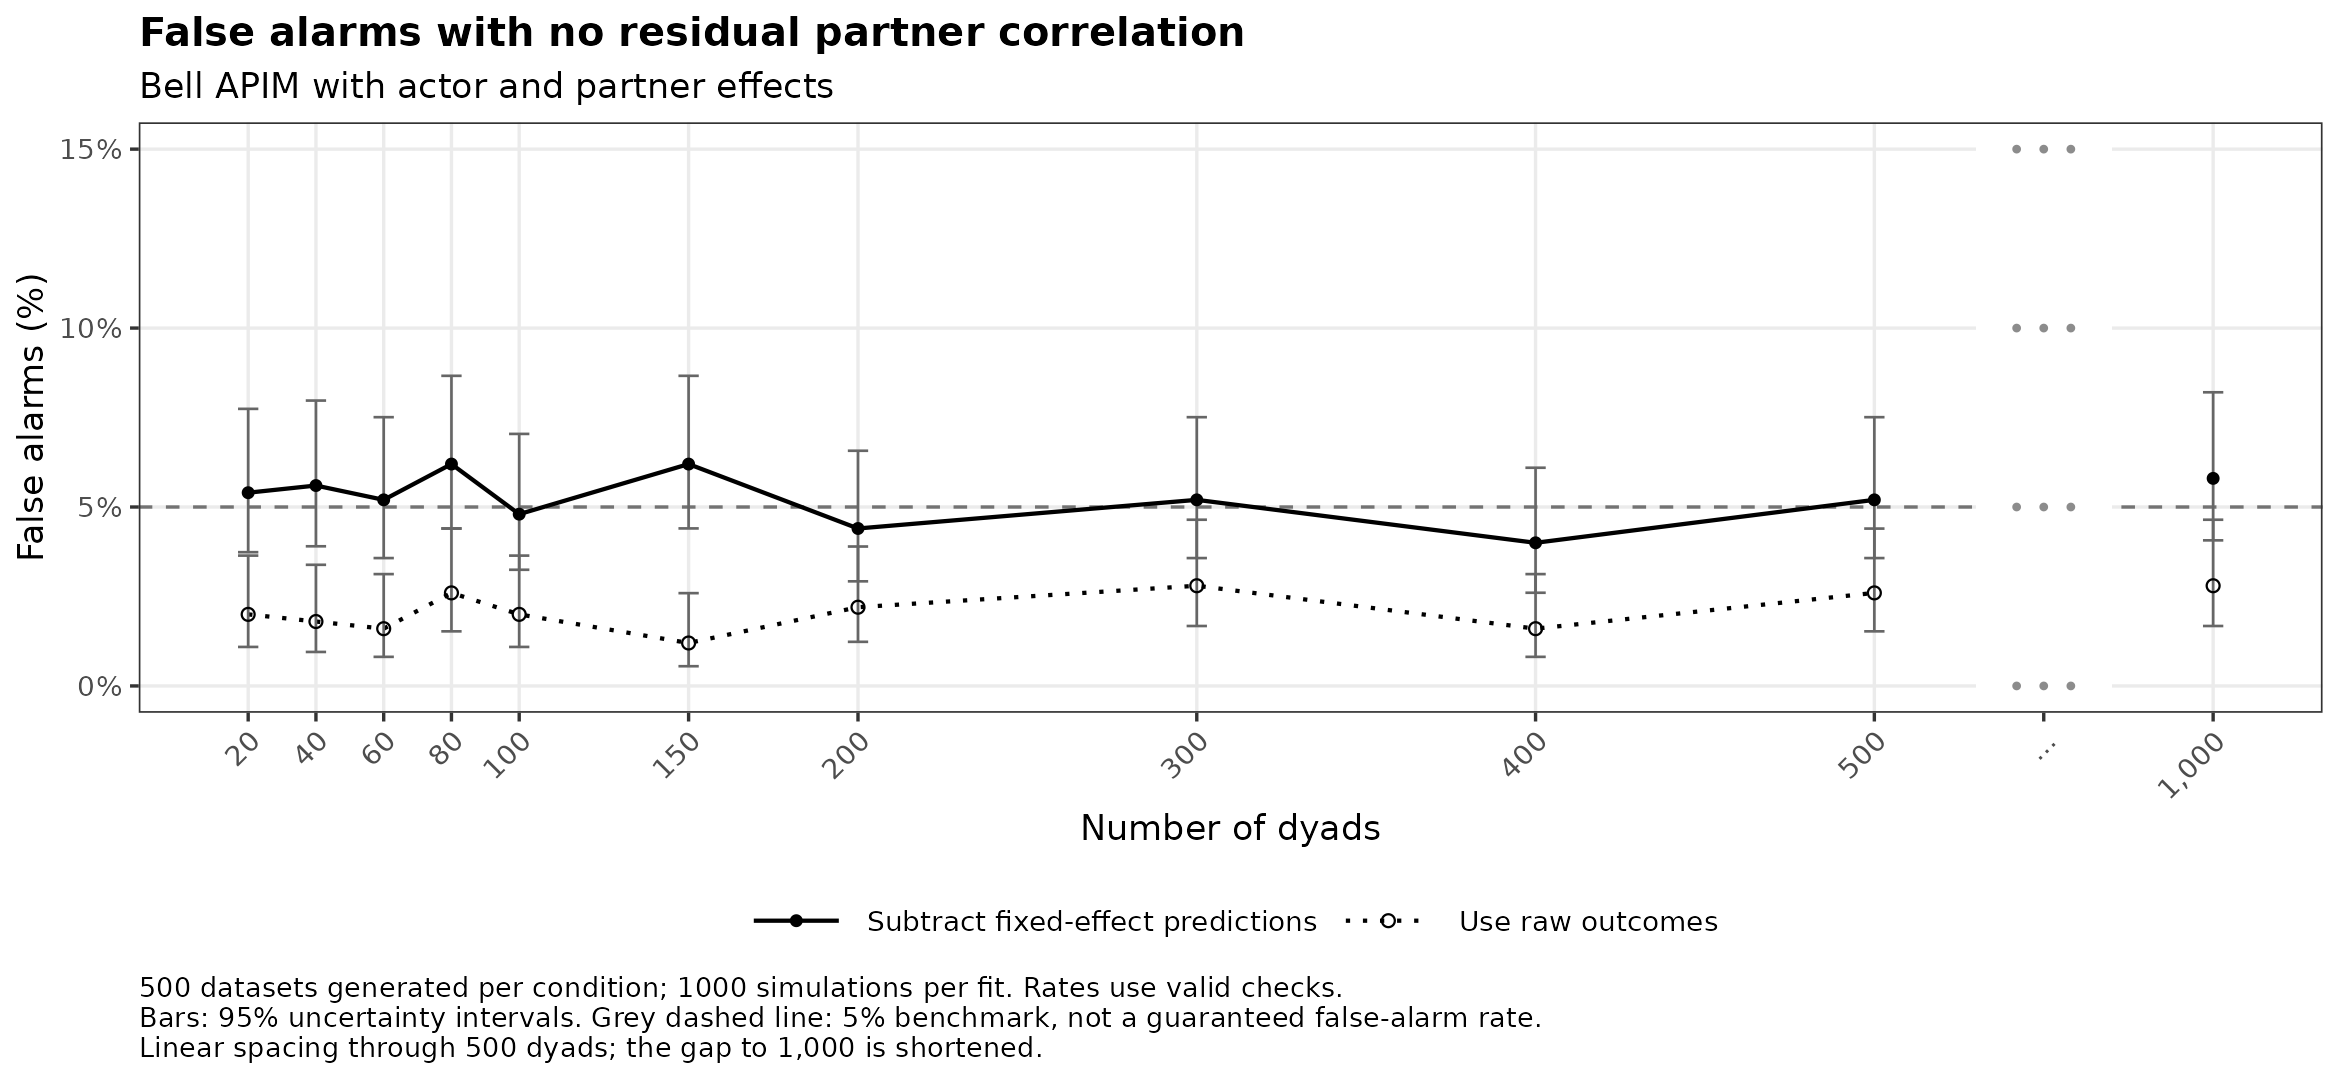
Model settings and checks
Fitted model:
outcome ~ actor_predictor + partner_predictor.
Mean: Actor effect 0.5, partner effect 0.3, log link, intercept 1.1.
Dispersion: Bell mean
Population correlations
Gaussian copula calibrated with 200000 pairs and independently verified with 500000 pairs.
| Target residual correlation | Verified correlation | Monte Carlo SE |
|---|---|---|
| 0.0 | 0.0 | 0.002 |
| 0.1 | 0.1 | 0.002 |
| 0.3 | 0.3 | 0.002 |
| 0.5 | 0.5 | 0.002 |
Opposite-direction flags with positive residual correlation
| Method | Datasets checked | Opposite-direction flags |
|---|---|---|
| model-centred | 16500 | 26 |
| raw | 16500 | 6 |
22000 of 22000 datasets produced reference simulations.
Counts for every plotted point are saved in the summary table.
Student t
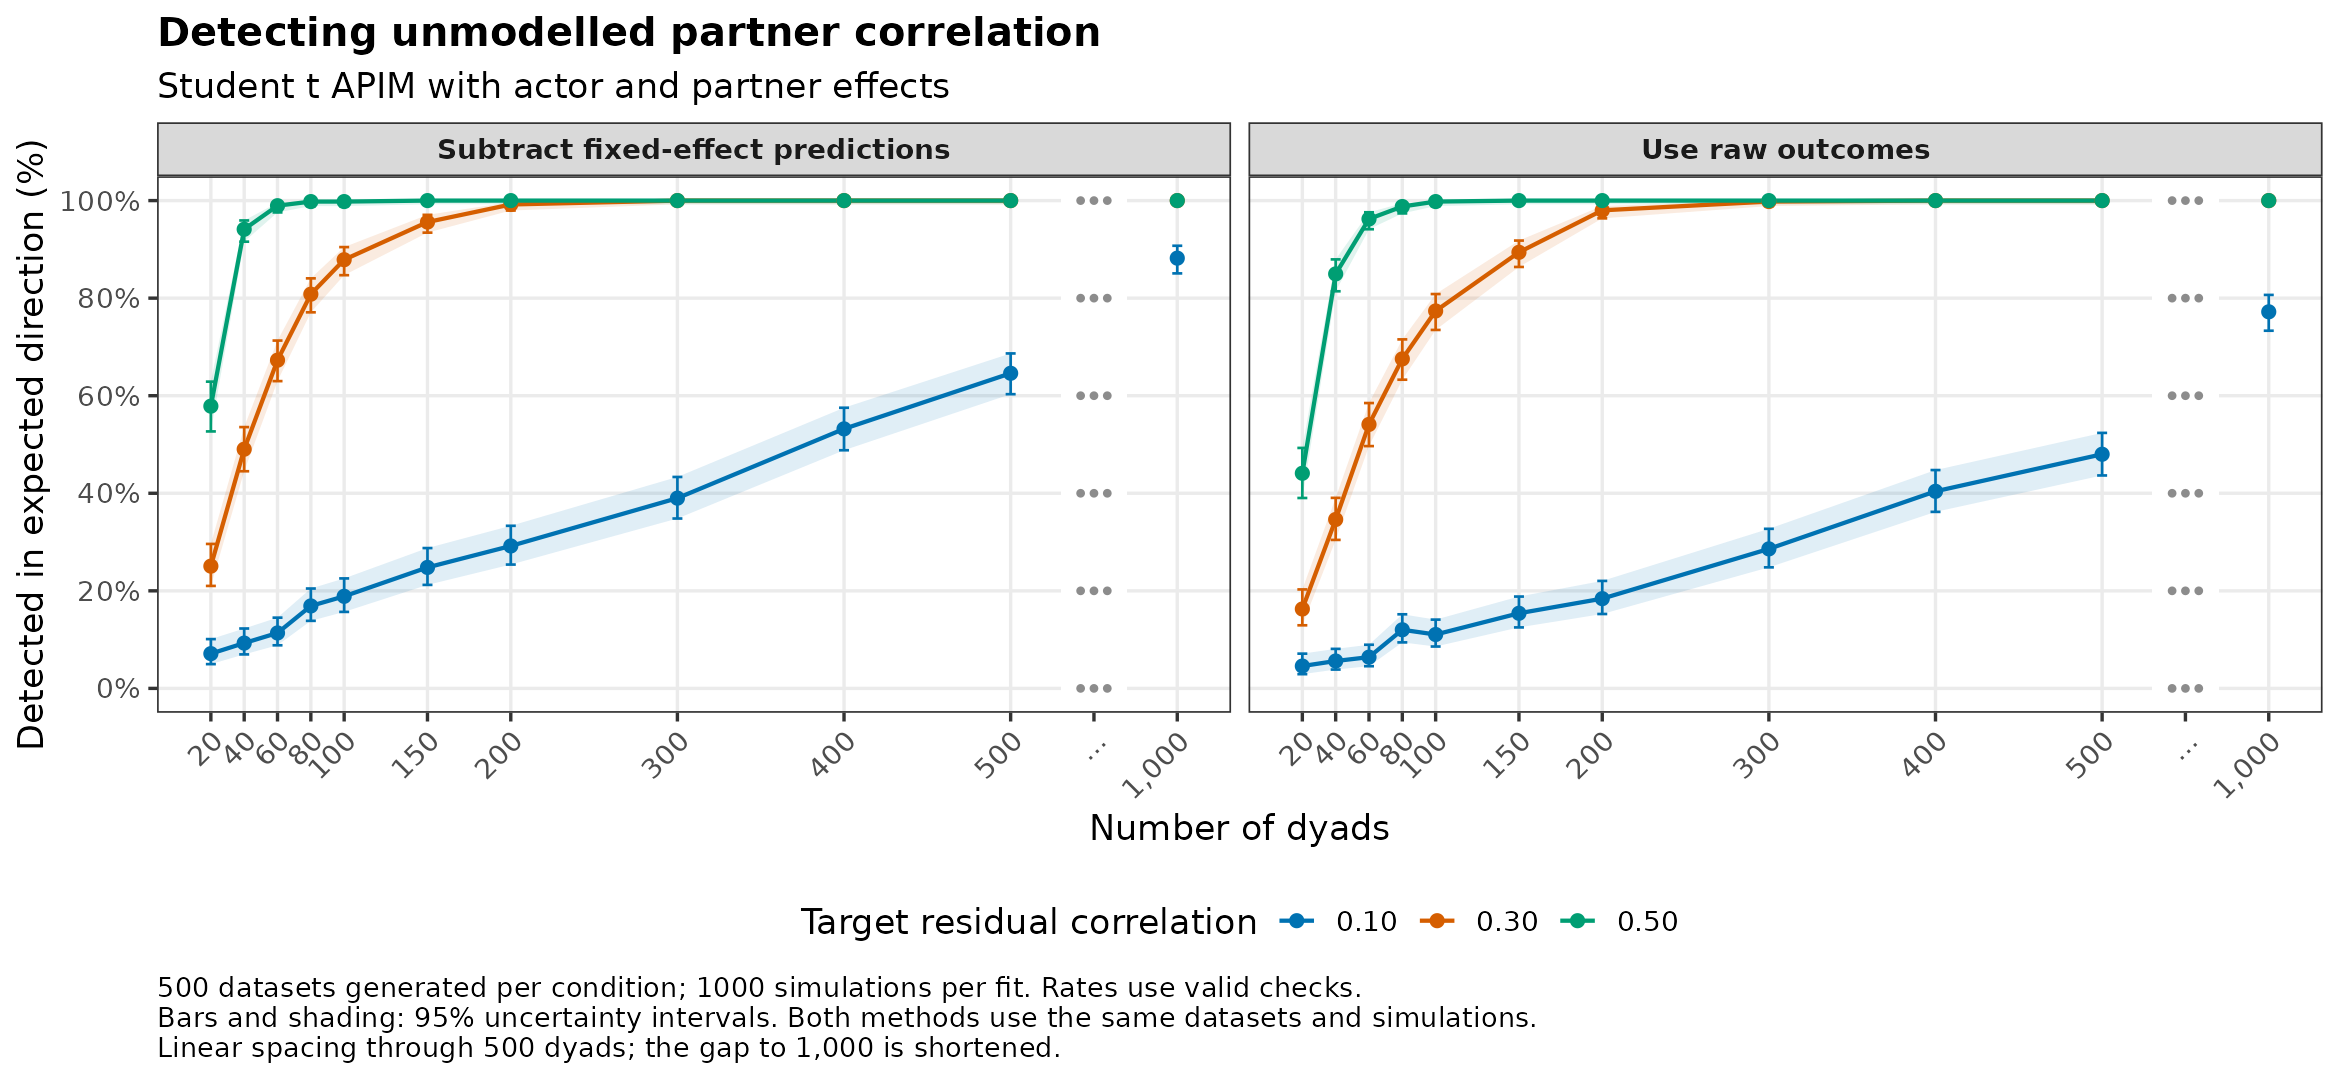
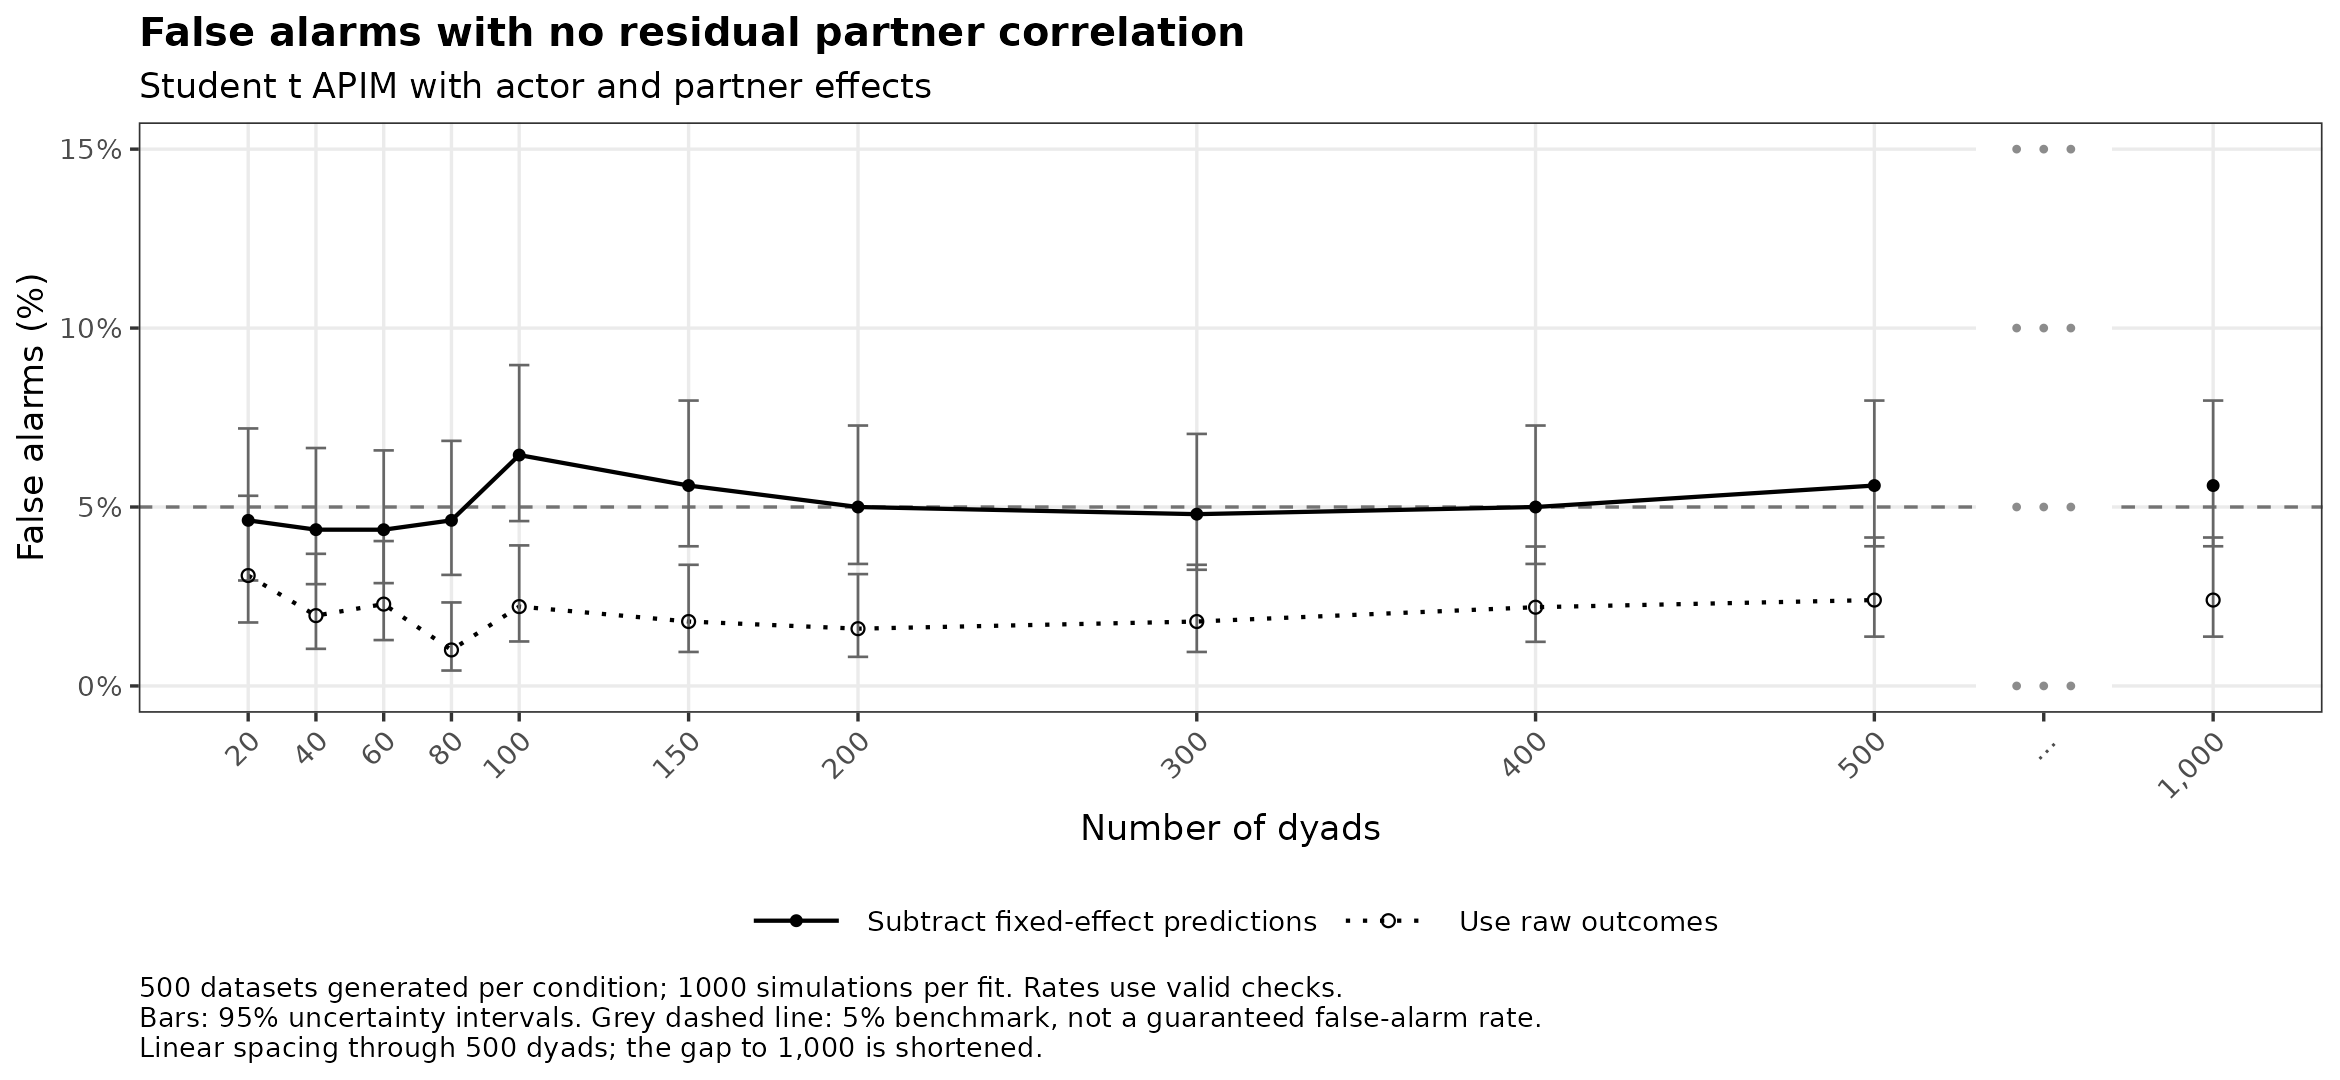
Model settings and checks
Fitted model:
outcome ~ actor_predictor + partner_predictor.
Mean: Actor effect 0.5, partner effect 0.3, identity link, intercept 0.
Dispersion: scale = 1, df = 5
Population correlations
Gaussian copula calibrated with 200000 pairs and independently verified with 500000 pairs.
| Target residual correlation | Verified correlation | Monte Carlo SE |
|---|---|---|
| 0.0 | 0.002 | 0.001 |
| 0.1 | 0.102 | 0.001 |
| 0.3 | 0.302 | 0.001 |
| 0.5 | 0.501 | 0.001 |
Opposite-direction flags with positive residual correlation
| Method | Datasets checked | Opposite-direction flags |
|---|---|---|
| model-centred | 15934 | 11 |
| raw | 15934 | 2 |
21255 of 22000 datasets produced reference simulations.
| Exclusion reason | Datasets |
|---|---|
| Check failed | 114 |
| Convergence or Hessian problem | 631 |
Conditions with fewer usable checks
| Dyads | Residual correlation | Methods | Generated | Checked |
|---|---|---|---|---|
| 20 | 0.0 | model-centred, raw | 500 | 389 |
| 20 | 0.1 | model-centred, raw | 500 | 393 |
| 20 | 0.3 | model-centred, raw | 500 | 387 |
| 20 | 0.5 | model-centred, raw | 500 | 356 |
| 40 | 0.0 | model-centred, raw | 500 | 458 |
| 40 | 0.1 | model-centred, raw | 500 | 463 |
| 40 | 0.3 | model-centred, raw | 500 | 465 |
| 40 | 0.5 | model-centred, raw | 500 | 459 |
| 60 | 0.0 | model-centred, raw | 500 | 481 |
| 60 | 0.1 | model-centred, raw | 500 | 484 |
| 60 | 0.3 | model-centred, raw | 500 | 486 |
| 60 | 0.5 | model-centred, raw | 500 | 478 |
| 80 | 0.0 | model-centred, raw | 500 | 497 |
| 80 | 0.1 | model-centred, raw | 500 | 491 |
| 80 | 0.3 | model-centred, raw | 500 | 490 |
| 80 | 0.5 | model-centred, raw | 500 | 493 |
| 100 | 0.0 | model-centred, raw | 500 | 496 |
| 100 | 0.1 | model-centred, raw | 500 | 498 |
| 100 | 0.3 | model-centred, raw | 500 | 495 |
| 100 | 0.5 | model-centred, raw | 500 | 496 |
Counts for every plotted point are saved in the summary table.
Ordinal
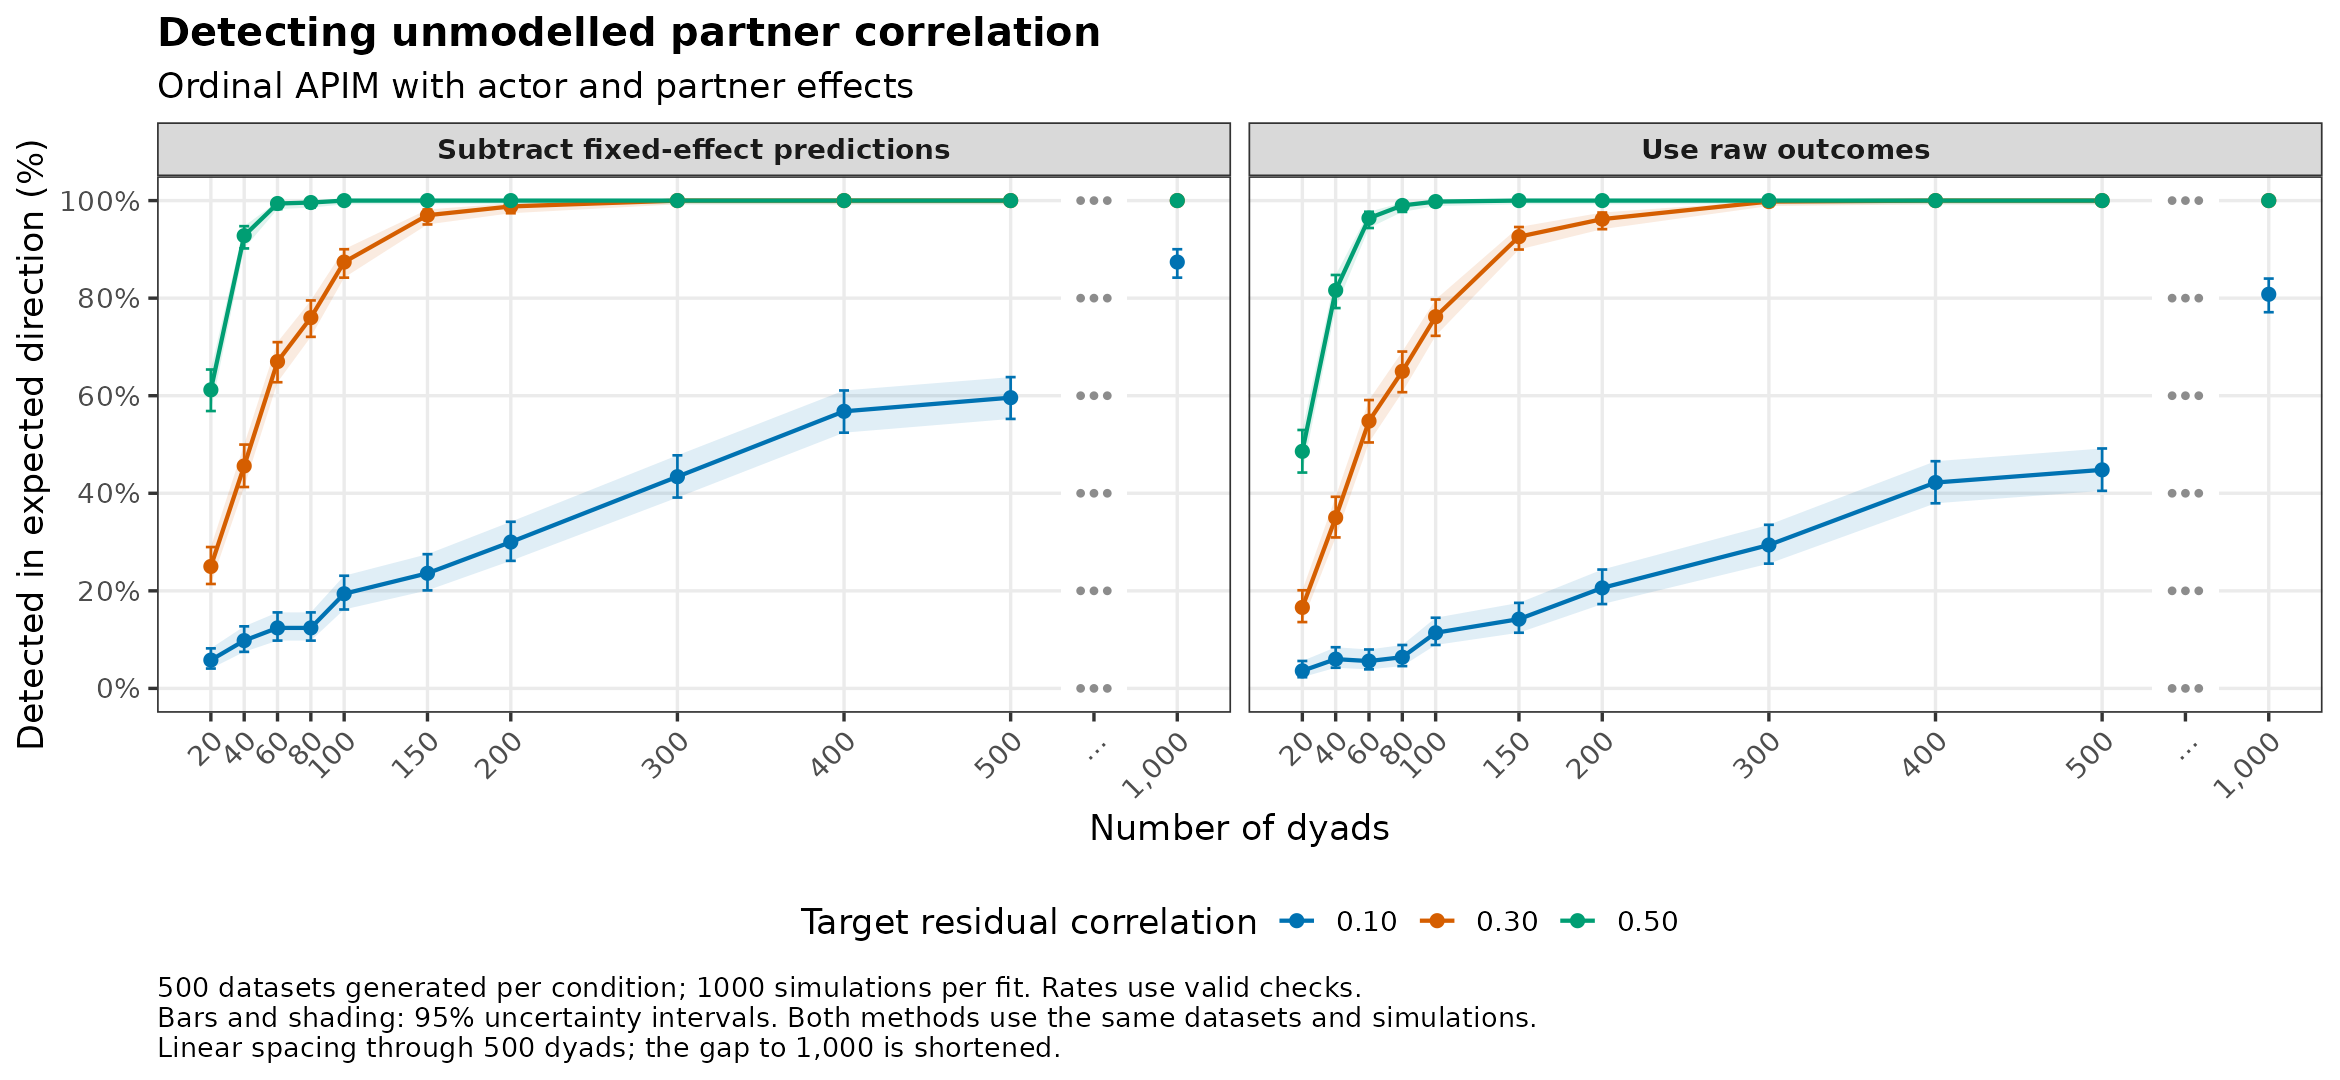
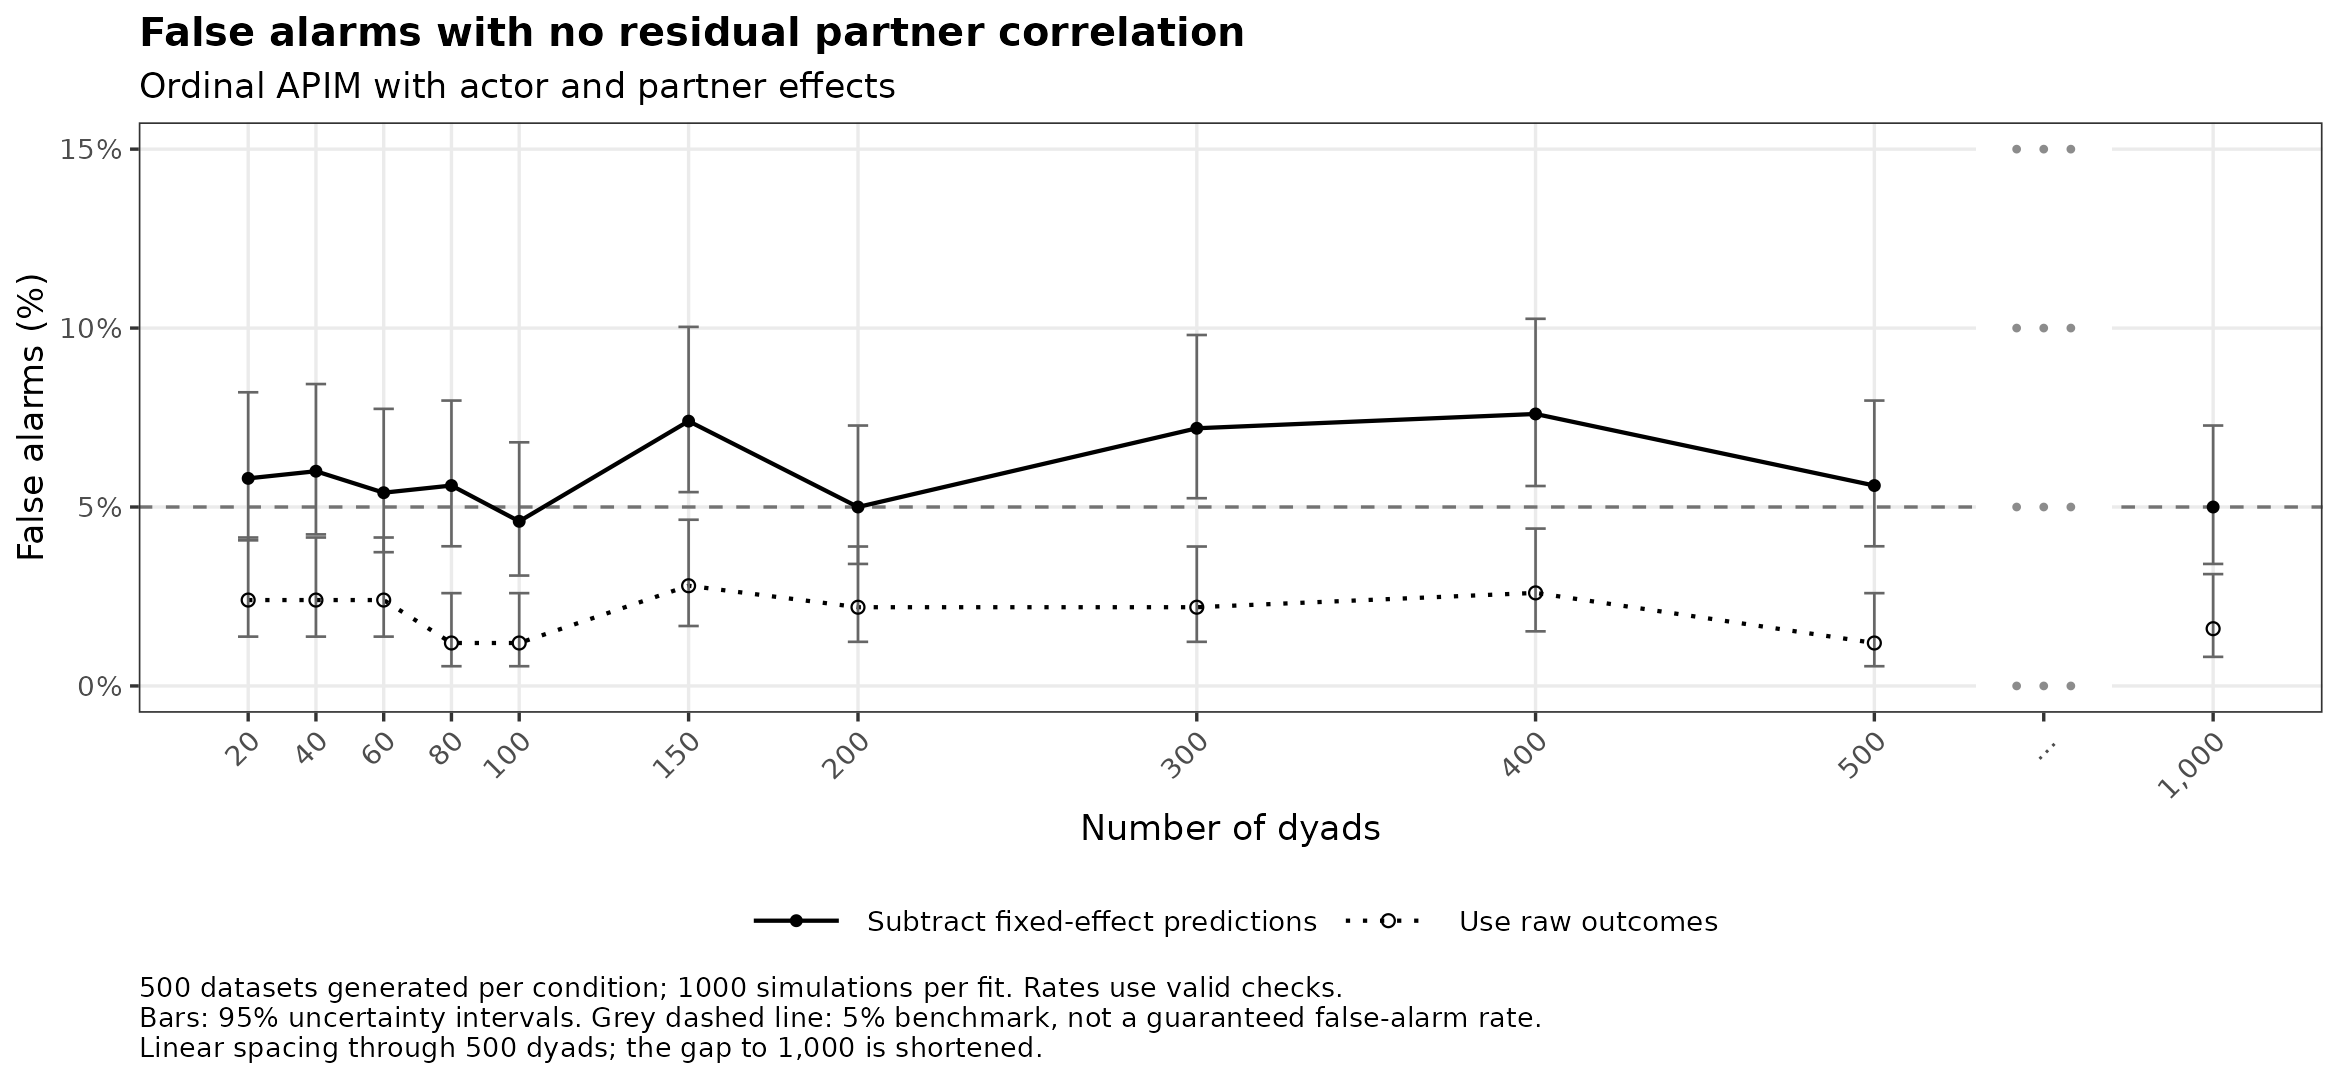
Model settings and checks
Fitted model:
outcome ~ actor_predictor + partner_predictor.
Mean: Actor effect 0.5, partner effect 0.3, probit link, intercept 0.
Dispersion: probit, thresholds -1, 0, 1, four categories
Population correlations
Gaussian copula calibrated with 200000 pairs and independently verified with 500000 pairs.
| Target residual correlation | Verified correlation | Monte Carlo SE |
|---|---|---|
| 0.0 | -0.001 | 0.001 |
| 0.1 | 0.101 | 0.001 |
| 0.3 | 0.302 | 0.001 |
| 0.5 | 0.502 | 0.001 |
Opposite-direction flags with positive residual correlation
| Method | Datasets checked | Opposite-direction flags |
|---|---|---|
| model-centred | 16500 | 10 |
| raw | 16500 | 3 |
22000 of 22000 datasets produced reference simulations.
Counts for every plotted point are saved in the summary table.
Zero-inflated Poisson
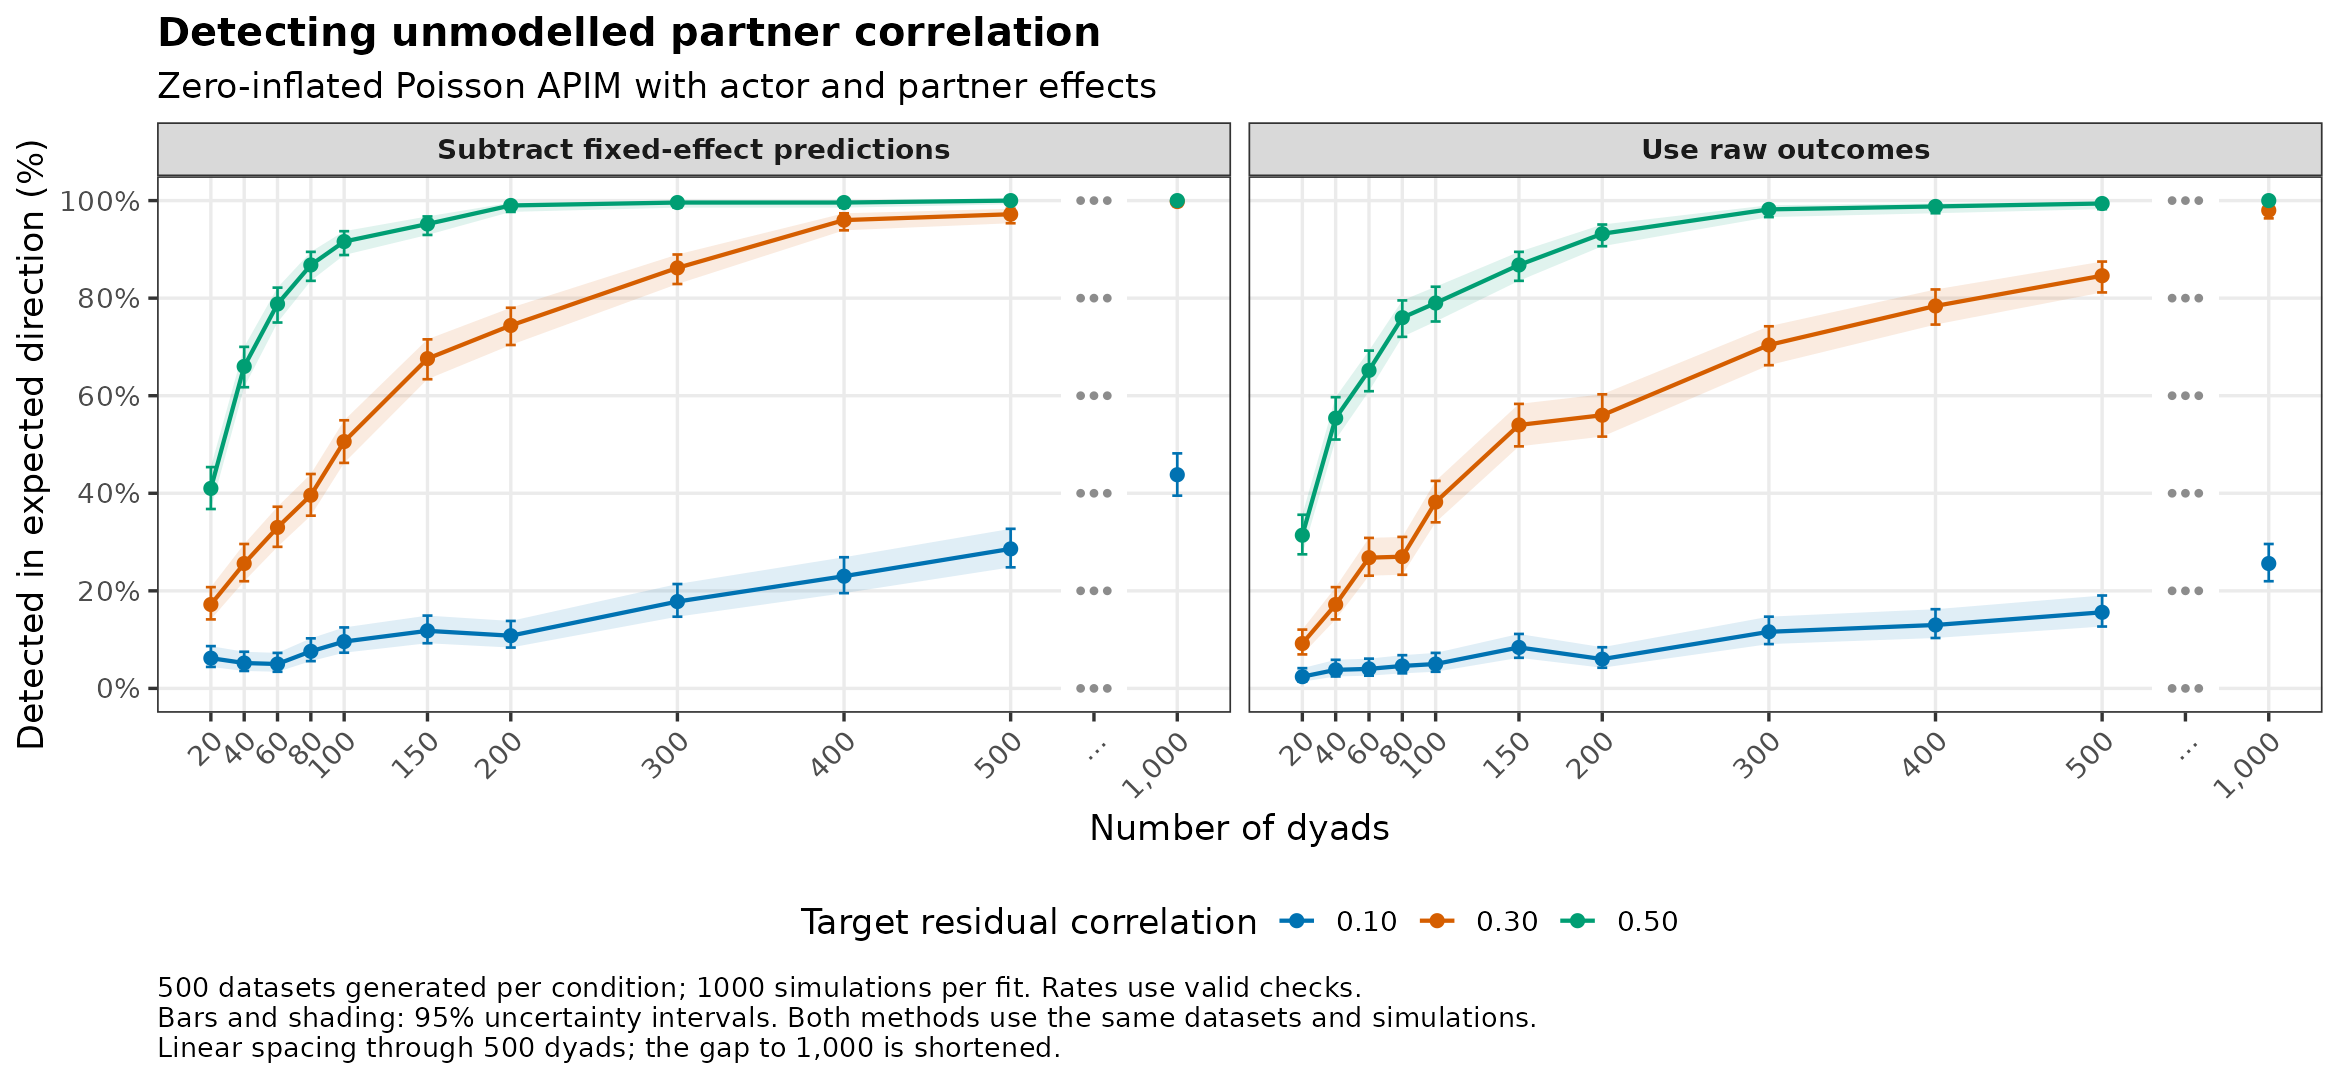
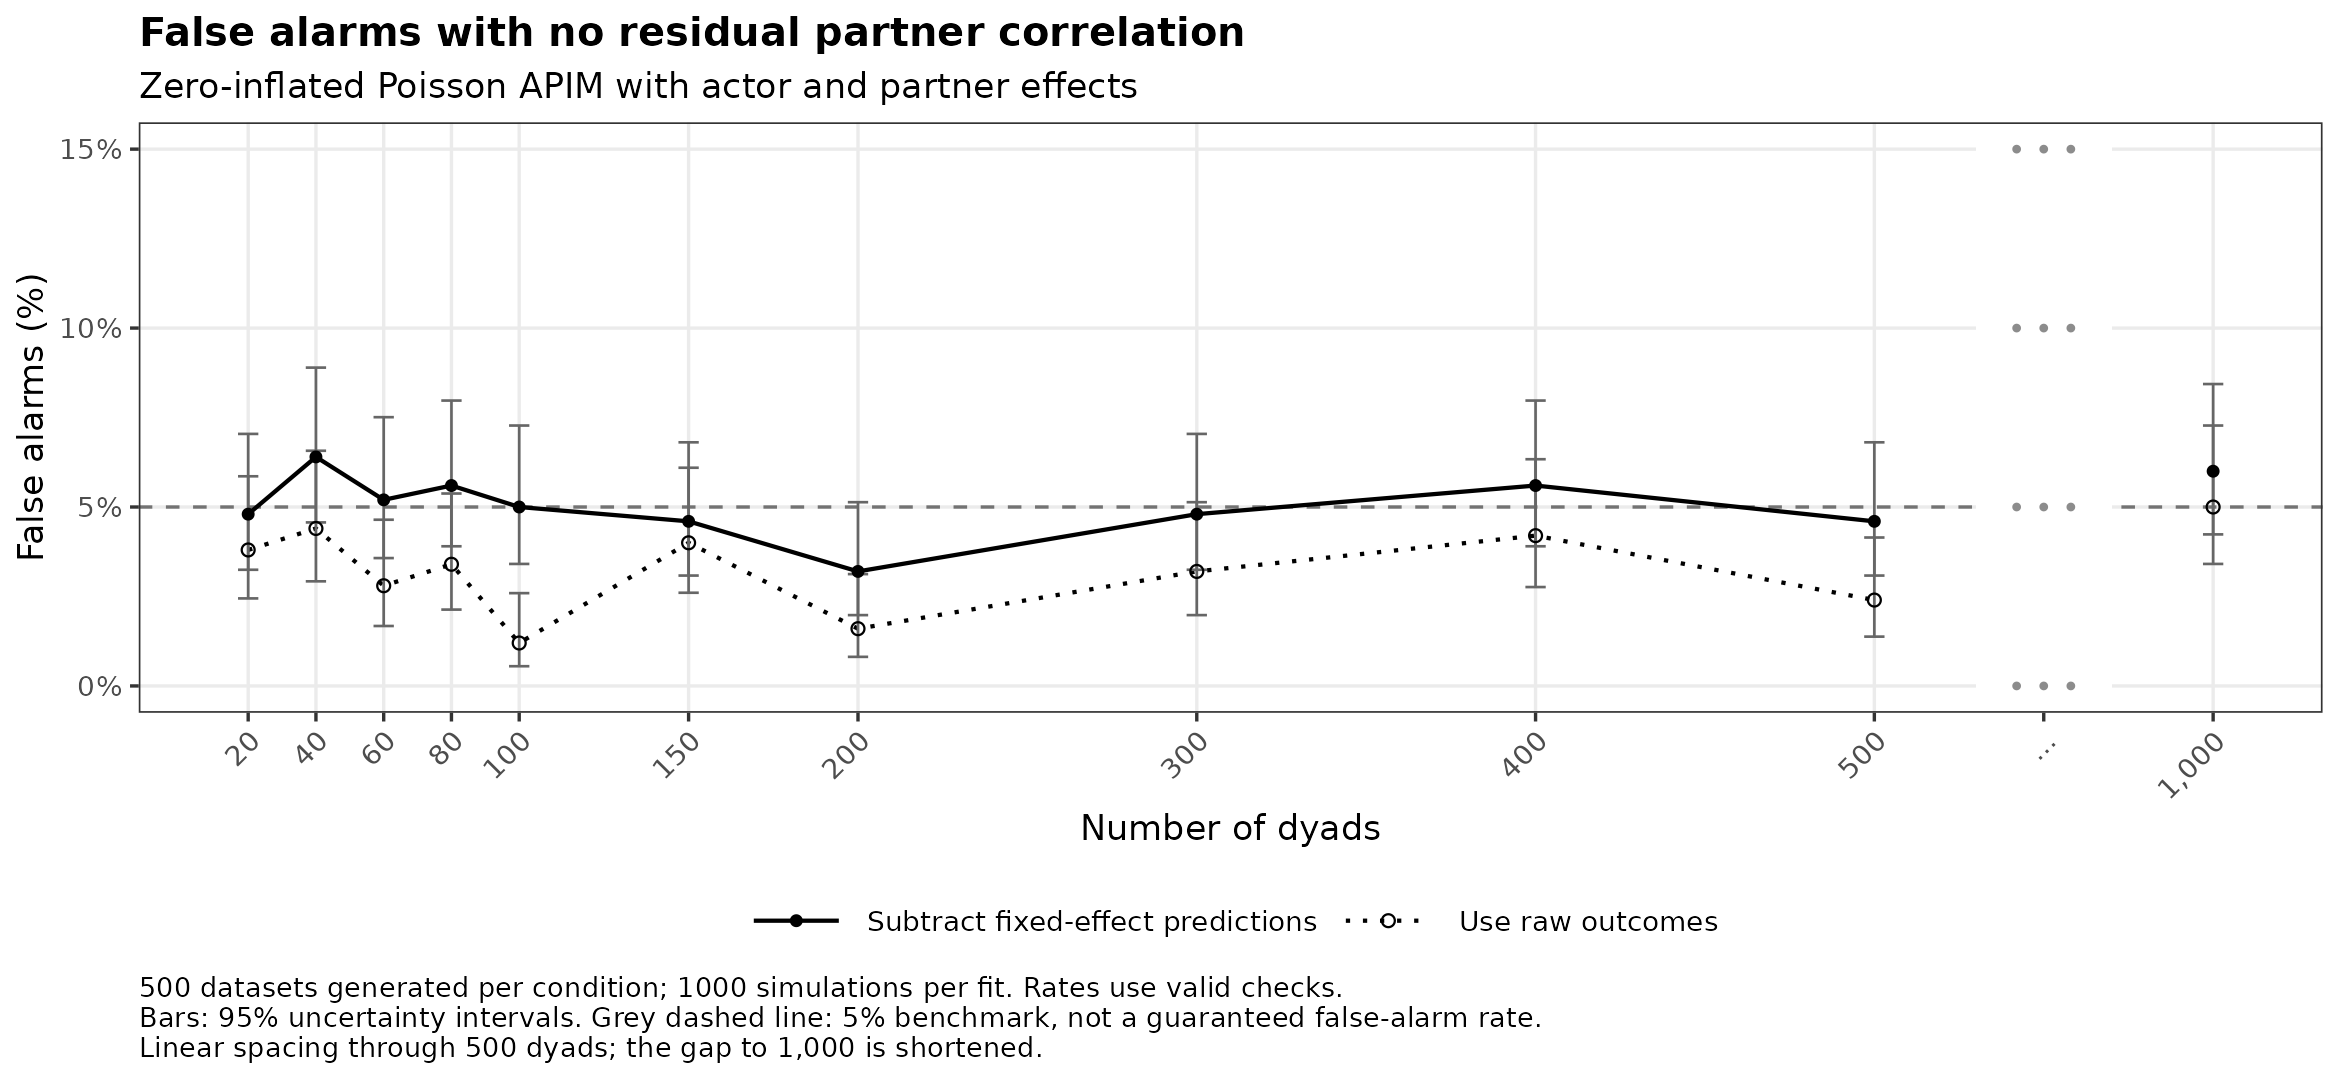
Model settings and checks
Fitted model:
outcome ~ actor_predictor + partner_predictor.
Mean: Actor effect 0.5, partner effect 0.3, log link, intercept 1.1.
Dispersion: Poisson mean, extra-zero probability = 0.25
Zero component: Constant zero component, probability 0.25, fitted with ziformula = ~1.
Population correlations
Gaussian copula calibrated with 1000000 pairs and independently verified with 2000000 pairs.
| Target residual correlation | Verified correlation | Monte Carlo SE |
|---|---|---|
| 0.0 | 0.000 | 0.001 |
| 0.1 | 0.097 | 0.001 |
| 0.3 | 0.298 | 0.001 |
| 0.5 | 0.498 | 0.001 |
Opposite-direction flags with positive residual correlation
| Method | Datasets checked | Opposite-direction flags |
|---|---|---|
| model-centred | 16500 | 27 |
| raw | 16500 | 24 |
22000 of 22000 datasets produced reference simulations.
Counts for every plotted point are saved in the summary table.
Hurdle negative binomial (NB2)
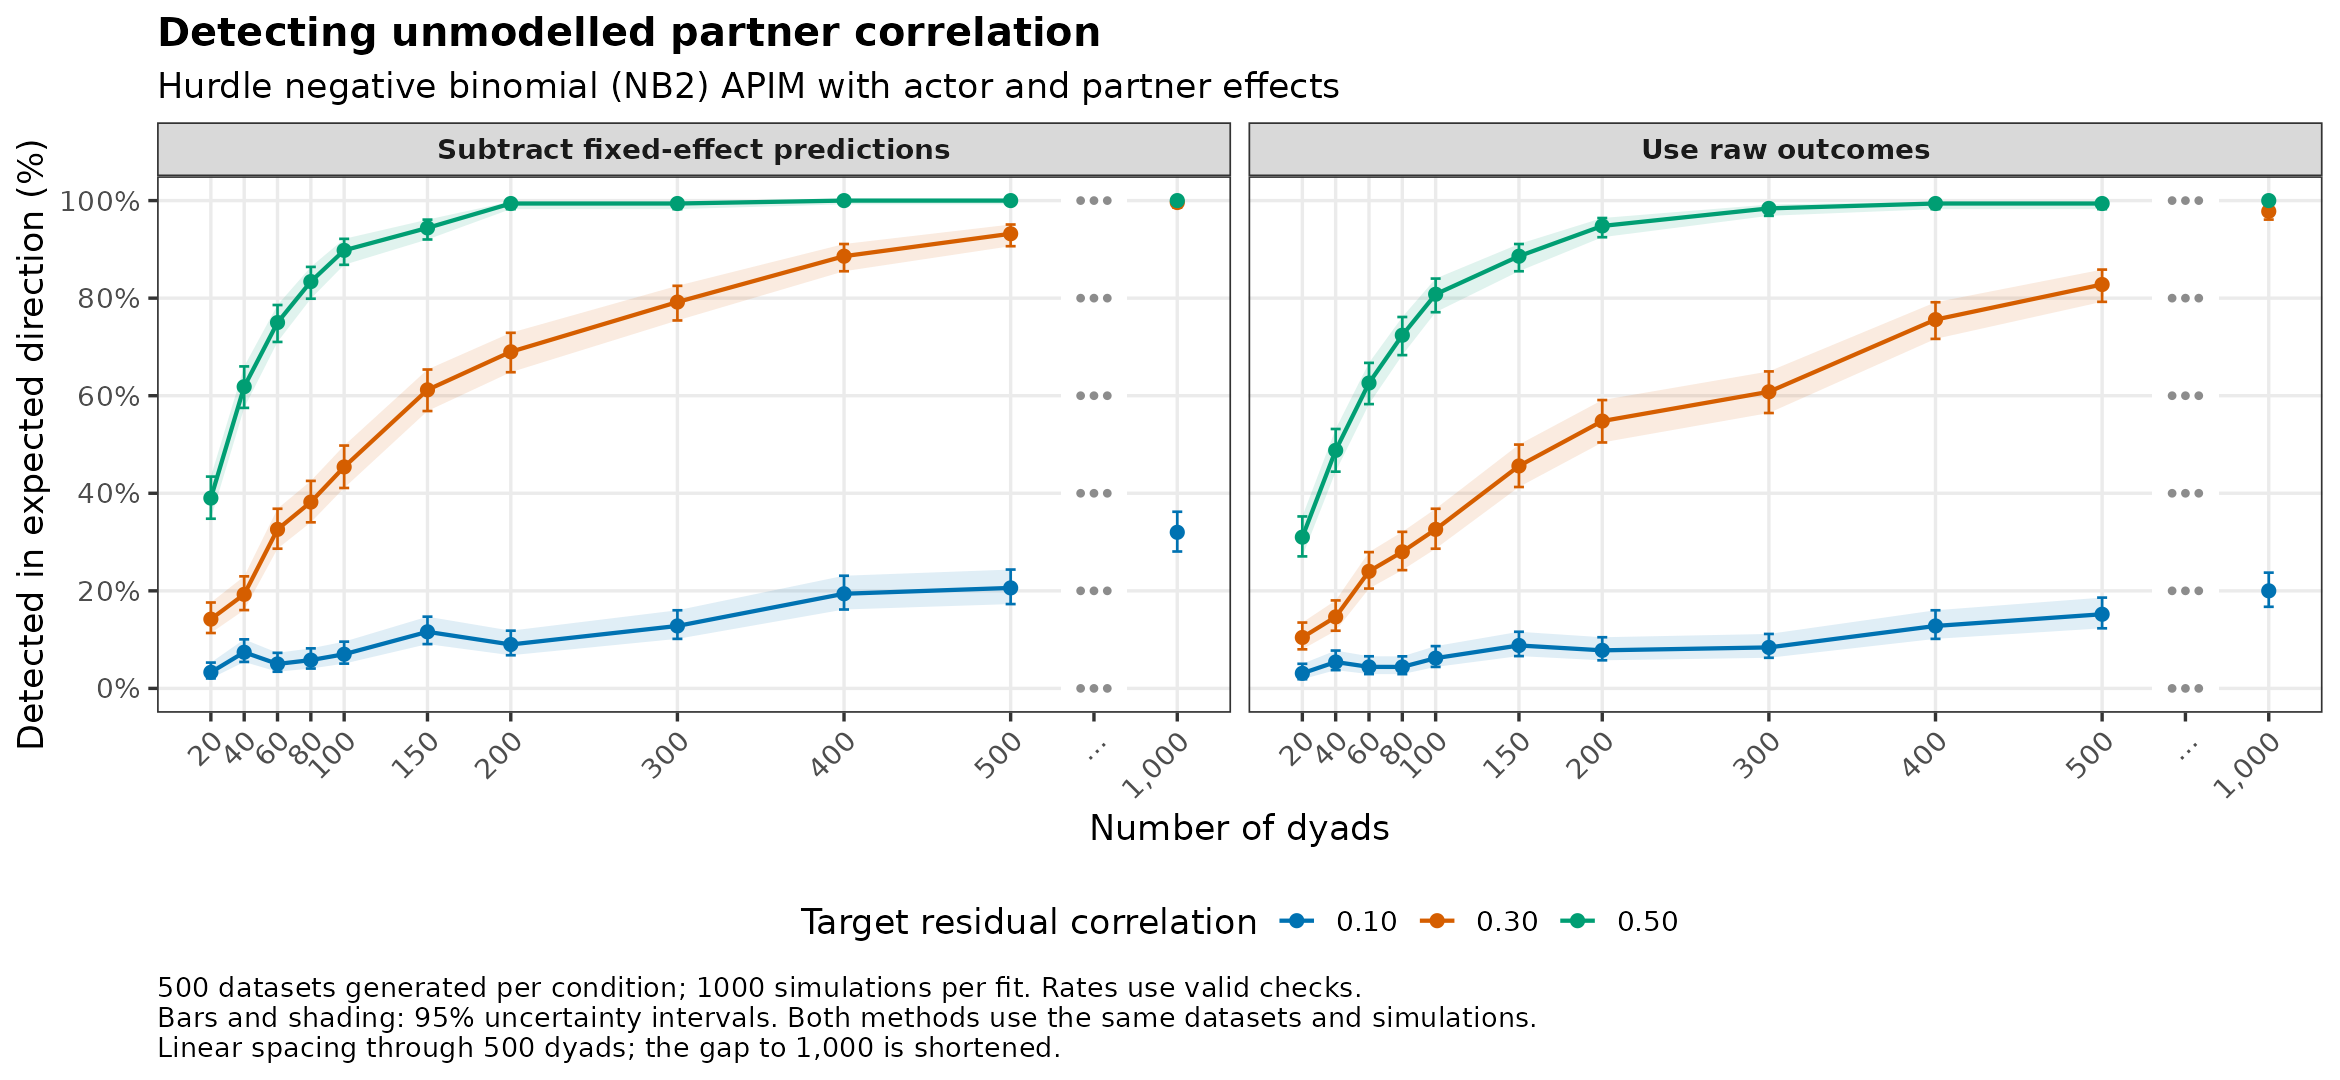
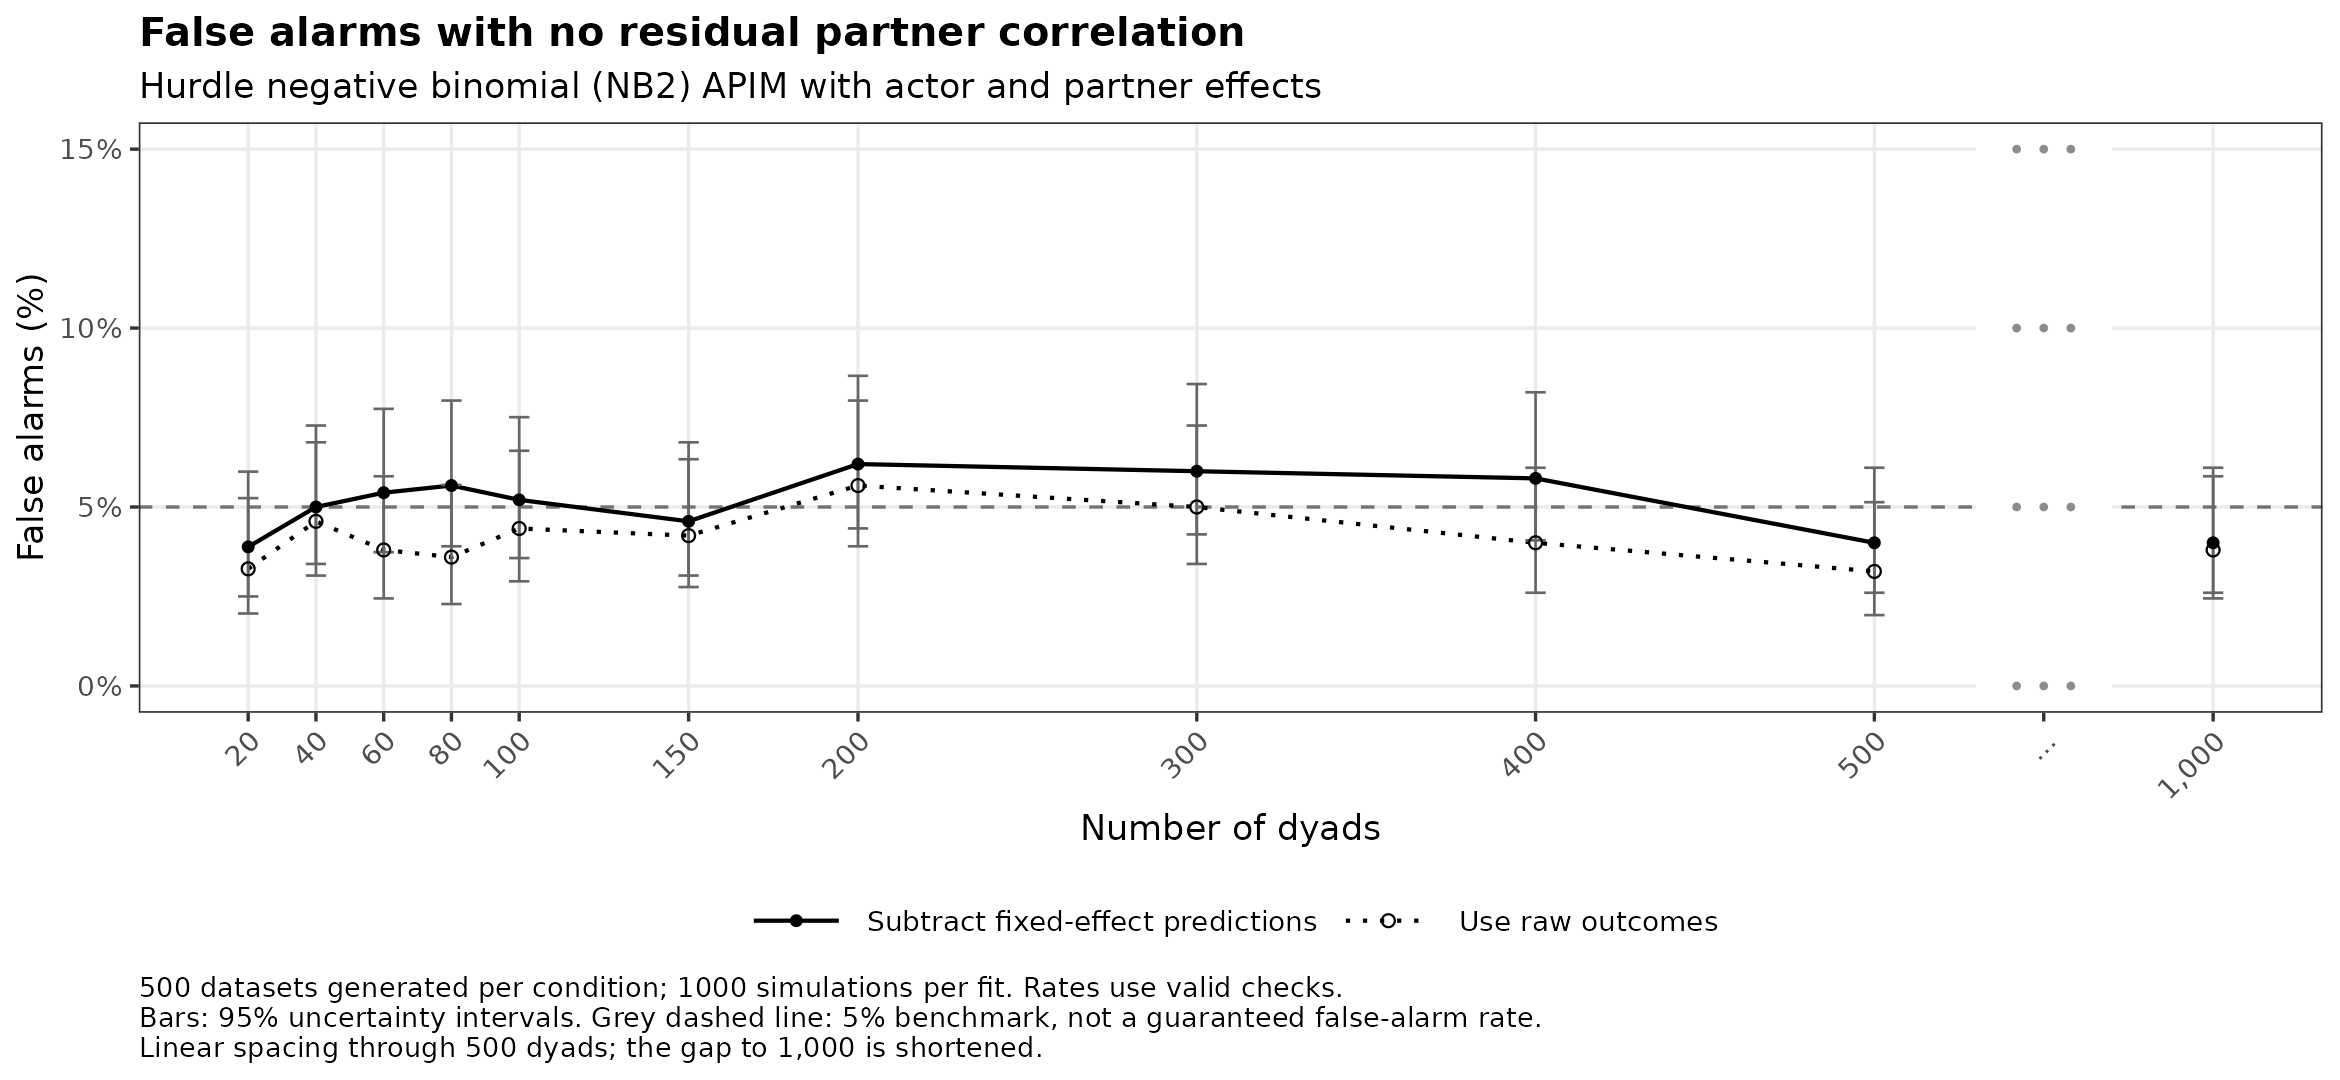
Model settings and checks
Fitted model:
outcome ~ actor_predictor + partner_predictor.
Mean: Actor effect 0.5, partner effect 0.3, log link, intercept 1.1.
Dispersion: size = 3, truncated at zero, extra-zero probability = 0.25
Zero component: Constant zero component, probability 0.25, fitted with ziformula = ~1.
Population correlations
Gaussian copula calibrated with 1000000 pairs and independently verified with 2000000 pairs.
| Target residual correlation | Verified correlation | Monte Carlo SE |
|---|---|---|
| 0.0 | 0.001 | 0.001 |
| 0.1 | 0.096 | 0.001 |
| 0.3 | 0.296 | 0.001 |
| 0.5 | 0.497 | 0.001 |
Opposite-direction flags with positive residual correlation
| Method | Datasets checked | Opposite-direction flags |
|---|---|---|
| model-centred | 16445 | 37 |
| raw | 16445 | 27 |
21934 of 22000 datasets produced reference simulations.
| Exclusion reason | Datasets |
|---|---|
| Convergence or Hessian problem | 66 |
Conditions with fewer usable checks
| Dyads | Residual correlation | Methods | Generated | Checked |
|---|---|---|---|---|
| 20 | 0.0 | model-centred, raw | 500 | 489 |
| 20 | 0.1 | model-centred, raw | 500 | 485 |
| 20 | 0.3 | model-centred, raw | 500 | 479 |
| 20 | 0.5 | model-centred, raw | 500 | 487 |
| 40 | 0.1 | model-centred, raw | 500 | 499 |
| 40 | 0.3 | model-centred, raw | 500 | 498 |
| 40 | 0.5 | model-centred, raw | 500 | 498 |
| 60 | 0.1 | model-centred, raw | 500 | 499 |
Counts for every plotted point are saved in the summary table.